The New PCE
The “Big Game” is Over. Who Won?
June 24, 2016The Labor Market Conditions Index
June 28, 2016The FED constantly talks about the PCE, or “personal consumption expenditures,” when discussing inflation. What – exactly – is it? Why is it so important? And how does the PCE differ from the CPI?
WHY YOU SHOULD CARE: Consumer spending makes up about 70% of the US gross domestic product, or GDP. The vast majority. And this is pretty much the same around the developed nations of the world.
So consumer spending is a big deal. What are the components of consumer spending? For example, in the big scheme of things, how important are “housing expenses” to the GDP calculation? How about auto sales?
Ultimately, changes in the price of the components of the PCE drive inflation or deflation. So when the media, for example, tells us…
“Inflation is creeping higher, but the primary source is rising shelter costs. Over the past 12 months, 60 percent of the increase in core consumer prices could be traced back to rents, lodging costs and rental equivalent of owner-occupied houses, the Labor Department said.”
…how concerned should be be about the overall inflation rate?
TAKING ACTION: Be informed. Know that consumer spending is critically important to both our economy as the FEDs determination to raise or lower interest rates. And understand how important various parts are to the whole.
The BLOG: You may have missed this amazingly exciting news, but back in 2007 the Bureau of Economic Analysis – the BEA – modified both the components of the PCE and their percentage weighting.
OK…maybe it wasn’t too exciting. I’m hearing a lot of yawns. But it is somewhat interesting. At least I think so. 🙂
Here’s a simple graphic:

Goods, services and income flow from US businesses to us. To businesses, we provide labor and we spend money. Seems pretty simple. So why did the BEA need to change how they calculate the PCE? Per the BEA, the new classification system:
- More accurately reflects current consumer spending patterns;
- More precisely matches products with the general PCE categories of “durable goods,” “non-durable goods,” and “services“; and,
- Makes some changes in how the PCE “excluding food and energy” is calculated;
Using their new methodology, they reclassified the 2002 PCE numbers as follows:

You can see the PCE is broken into three major groups, with this weighting:
- Durable Goods – 13.1%
- Nondurable Goods – 22.6%
- Services – 64.3%
What’s the difference between Durable and Nondurable goods? Simply stated, time. Generally, durable goods tend to last longer than 3 years. Nondurables tend to be consumed in less than 3 years. So a new ‘outfit’ from the mall is probably nondurable. A new car or washing machine, durable.
How does the old classification system compare to the new? Let’s take a look:

Not too much different. The biggest difference is how the smaller pieces of the puzzle are allocated. Using 1997 PCE as an example for reallocation, we can see that there is no change in the total of the PCE…
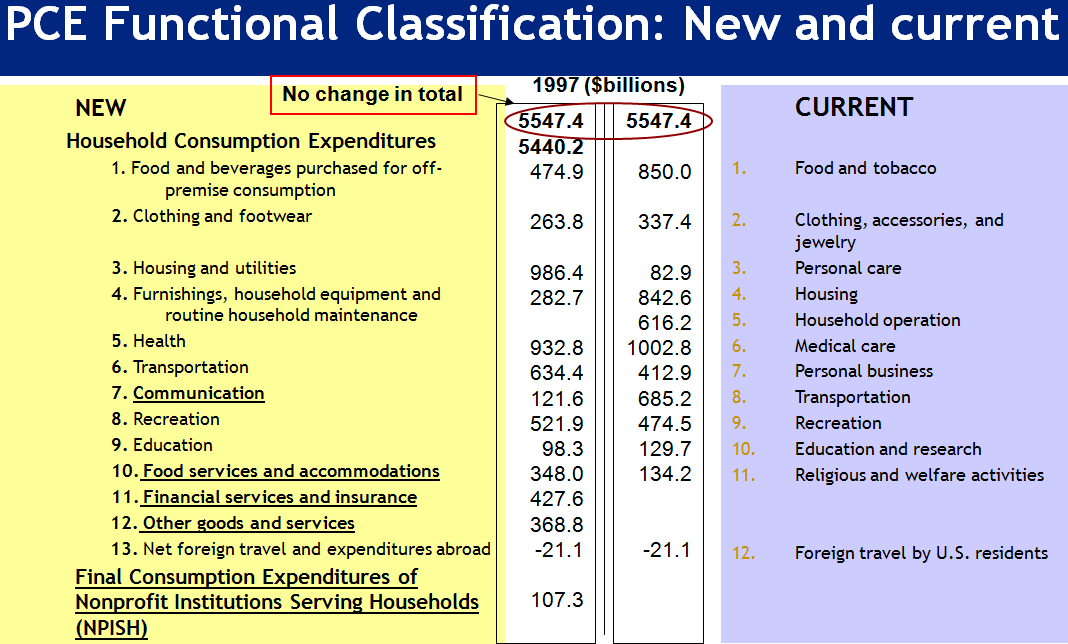
…but the ‘new’ PCE adds new categories (while deleting some others)…
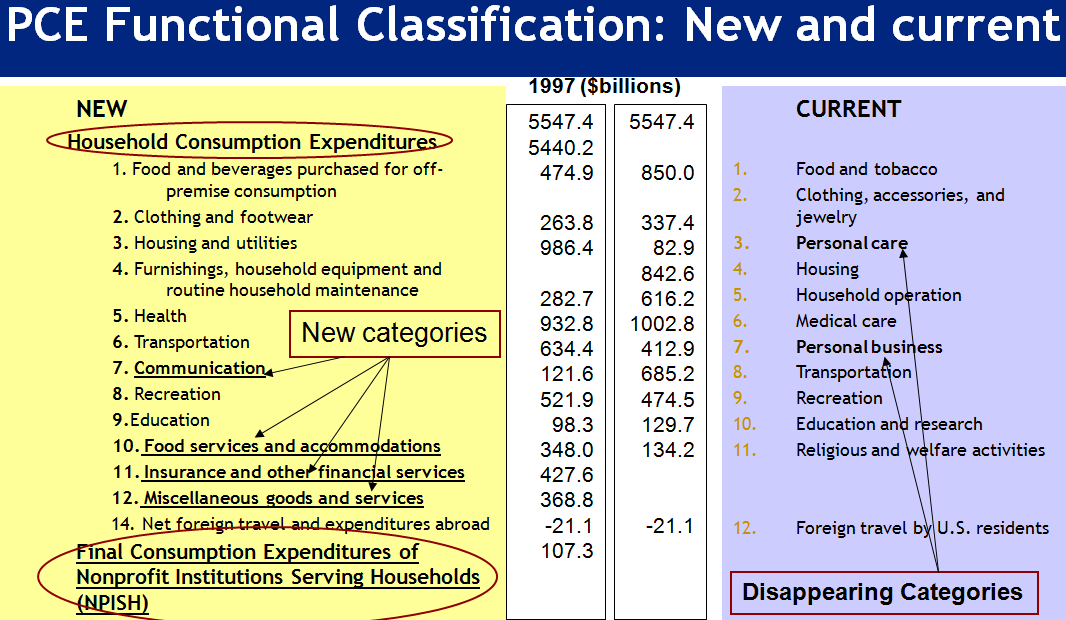
…and re-classifies certain expenditures to reflect more current buying patterns:

OK…all in all, the new approach makes sense. (If you’d like to read more on this topic, here’s a great detailed explanation from the BEA:)
http://www.bea.gov/scb/pdf/2008/05%20May/0508_nipa_pce.pdf
Back to the original question: Do significantly to changes in housing cost – reflected in “Housing and Utilities” in the chart above – impact the overall PCE? As you can see, it’s one of the largest components at 17.4%. In second place, “Health Care” at 15%. Combined, these two make up about 1/3 of the total PCE index. Hmmm….
And both are rising today. Health Care ‘inflation’ per the St. Louis FED, in January of:
- 2013 – (.031%)
- 2014 – 1.77%
- 2015 – 5.38%
- 2016 – 2.77%
Rent inflation per SL FED – this time more recent – year-over-year each May of:
- 2013 – 2.05%
- 2014 – 2.67%
- 2015 – 2.736%
- 2016 – 3.102%
These are the big boys. The movers and the shakers.
Everything else, not so much. Motor vehicles, transportation, and gas/energy combined, make up less than 12%.
Let’s get back to a question I posed at the top of this BLOG: How is the PCE different than the CPI? Here’s a comment from the Cleveland FED in mid-2014:
“The two measures, though following broadly similar trends, are certainly not identical. In general, the CPI tends to report somewhat higher inflation.
In this century, then, CPI inflation has run about half a percentage point higher than PCE inflation. When calculated from 1960 the difference is almost the same, 3.9 percent for the CPI and 3.4 percent for the PCE. Since 2008, however, the difference has been smaller, 1.7 percent and 1.4 percent.”
Interesting. OK…why does the CPI tend to reflect a higher inflation rate than the PCE? Two reasons. First, methodology. Here’s another comment from the Cleveland FED:
The two indexes have different estimates of the appropriate basket. The CPI is based on a survey of what households are buying; the PCE is based on surveys of what businesses are selling.”
Second, due to how the components are weighted. For example, the PCE weighs ‘housing and utilities’ at 17.5% of the total index, while the CPI weighs housing expense at a little over 30% of the CPI-U. If we throw in “fuels and utilities” the number is closer to 36%. About double the index weight for housing in the PCE. I think this accounts for most of the variance…and is the reason why the CPI will always be significantly higher than the PCE.
So, when we’re inflation hunting, we’ll be watching rents and health care costs closely. These will move the needle. More in the CPI…but in the PCE as well.
- Terry Liebman