
SHI: 10/25/14 Recession Talk

SHI: 10/18/17 Rent or Buy, Prices are Steep
October 18, 2017
SHI 11/1/17: Below the Radar
November 1, 2017
Many are concerned the current economic expansion will soon die of old age.
Could they be right? Can the simple passage of time cause cause a recession? We’ve covered this topic before, but its worth another look.
Welcome to this week’s Steak House Index update.
If you are new to my blog, or you need a refresher on the SHI, or its objective and methodology, I suggest you open and read the original BLOG: https://www.steakhouseindex.com/move-over-big-mac-index-here-comes-the-steak-house-index/
Why You Should Care: The US economy and US dollar are the bedrock of the world’s economy. This has been the case for decades … and will continue to be true for years to come.
Is the US economy expanding or contracting?
The world’s GDP is about $76 trillion. At last count, our ‘current dollar’ US GDP is now over $19 trillion — about 25% of the global total. Other than China — a distant second at around $11 trillion — no other country is close.
The objective of the SHI is simple: To help us predict US GDP movement ahead of official economic releases — important since BEA data is outdated the day they release it.
‘Personal consumption expenditures,’ or PCE, is the single largest component of US GDP — about 2/3 of the total. In fact, the majority of all US GDP increases (or declines) usually result from (increases or decreases in) consumer spending. Thus, this is clearly an important metric to track. The Steak House Index focuses right here … right on the “consumer spending” metric.
I intend the SHI is to be predictive, anticipating where the economy is going – not where it’s been. Thereby giving us the ability to take action early.
Taking action: Keep up with this weekly BLOG update. Not only will we cover the SHI, but we’ll explore related items of economic importance.
If the SHI index moves appreciably -– either showing massive improvement or significant declines –- indicating expanding economic strength or a potential recession, we’ll discuss possible actions at that time.
The BLOG:
Many are concerned the current economic expansion will soon die of old age.
Now the 3rd longest expansion on record since the National Bureau of Economic Research (NBER) began tracking such things back in 1854, the expansion getting rather long in the tooth. Born in June of 2009, this expansion is fast approaching its 100th month birthday! Let’s throw a party! 🙂
But while its duration is rather long, when measured by SIZE, as opposed to TIME, this recovery is one of the weakest on record when measured from the perspective of GDP growth:
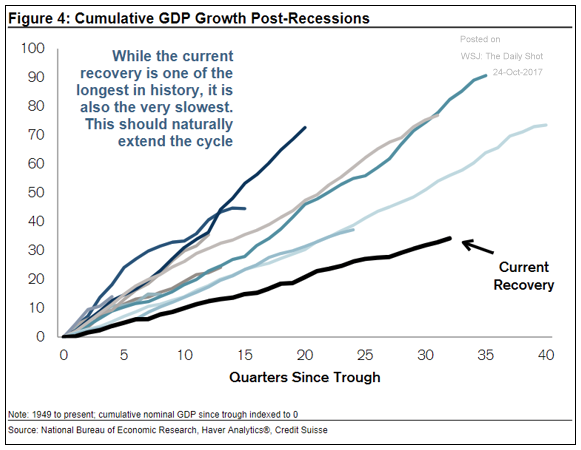
The typical US expansion adds meaningfully to the GDP. While this expansion has been long, it has not been strong. As we see above, US GDP is only about 34% higher than when the recovery began. Compare this number to all other recoveries since 1949. Paltry by comparison.
It’s also interesting to note economic expansions seem to be lasting longer these days. Much like human life expectancy, economic ‘expansion life expectancy’ appears to be increasing. The chart below (I apologize for the poor quality — I’m traveling so I’m “technology challenged”. This is a photo of a printed chart provided by JPM Chase) shows a bar chart of recession and expansion durations. Notice how the blue lines are generally getting longer? My added red line shows trajectory. Take a look:
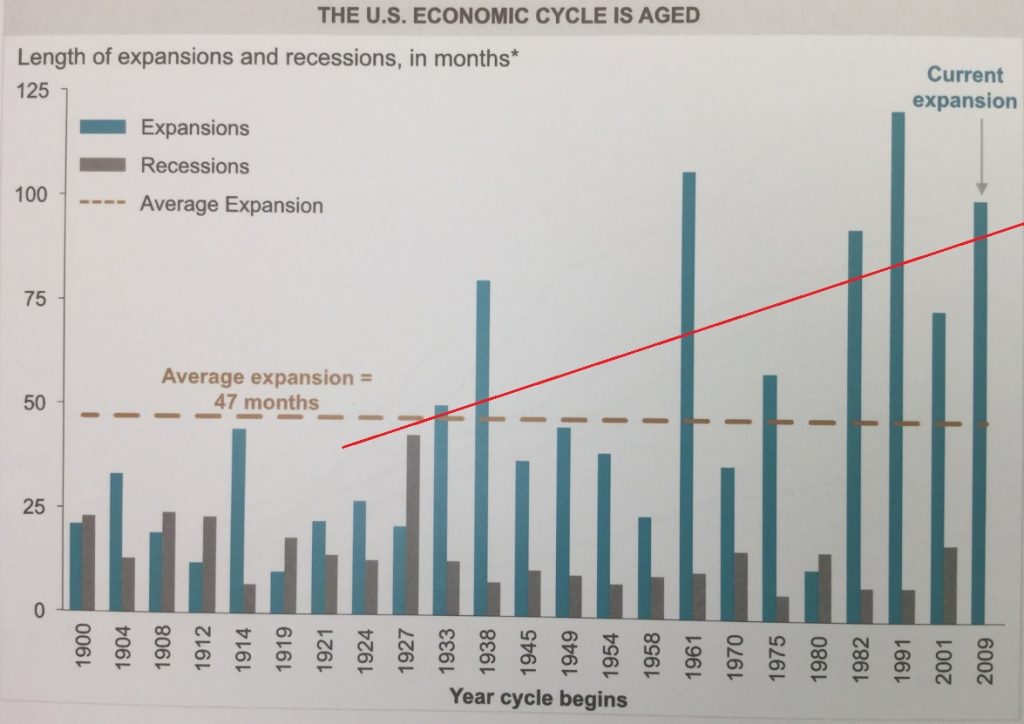
If durations are lengthening, and this expansion has been exceptionally weak, it stands to reason we have plenty of time left. There are no observable bubbles or excesses, the yield curve remains positive, and the FED rate tightening cycle and balance sheet normalization are methodical and steady, all of which historically tend to push our economy into recession.
Don’t misunderstand me: A recession will occur, eventually — this is inevitable. But the catalyst will be something quite unexpected. Perhaps a debt bust in Venezuela, a housing crisis in China, disruption in liquidity or valuation of ETF bond funds, or a North Korean missile ‘accidentally’ landing in Tokyo.
Let’s move to the steakhouse. How full are our esteemed well-heeled eateries this Saturday? Is Mastros Ocean Club packed once again? Let’s take a look:
Oops. We’re having technical difficulties. I’m traveling this week and working from my iPad. On the good news side of the ledger, I’m able to operate Excel and calculate the SHI: This week, we’re at a negative <-14>. The bad news: Copying images seems to be impossible.
Regardless, let’s compare the current SHI to last year’s: On 10/26/16, the SHI was a negative <-8>. Hmmm…pretty close. Mastros, of course, was fully booked in both. No time slots were available until 9:15 pm. This week, only Ruths’ Chris had one time-slot fully booked, and that was 7:00 pm. The gap is down to only 6 — this is the smallest 2016/2017 gap we’ve seen in weeks, and ties the all-time low for 2016.
I’ll insert graphs when I return to my office this weekend. I apologize.
What does this portent? Once again, the SHI is predicting a ‘soft’ Q3 GDP growth number. And in only 2 days — on October 27th at 5:30 am California time — the BEA will release their first or “advanced” estimate for Q3 2017 US GDP. This is what we’ve been waiting for. I’m sure, like me, early Friday morning you’ll be watching CNBC, on pins and needles. 🙂
On October 20, the latest and final (Q3) NY Fed “nowcast” stood at 1.46%. 2 days prior, on October 18, the Atlanta Fed was predicting a third quarter GDP growth rate of 2.7%. In my book, that’s a wide divergence.
For some time now, the SHI has been predicting a weak Q3 showing. Likely in the 1.5-1.9% range. Since we need a prediction, let’s go with an SHI Q3 GDP of 1.8% — just about in the middle of the NY Fed and Atlanta Fed estimates.
At long last, on Friday we’ll finally learn if the SHI is prime USDA beef or simply unappetizing grain filler. Exciting!
- Terry Liebman


