SHI 5.27.20 – Climbing the Mountain

SHI 5.20.20 – Smoking Cigarettes Can Kill You
May 20, 2020
SHI 6.3.20 – Disasters: Natural and Unnatural
June 3, 2020
The US has built up a mountain of sovereign debt … and the mountain is growing. The ‘Great Shutdown’ is the cause. Federal stimulus programs are the response. And an ever taller, steeper mountain of debt is the outcome. These are the facts. Here’s a question you may be wondering about:
” Can the US government afford to pay the interest on its growing federal debt? “
A worthy question to be sure, in light of the fact that this year’s budget deficit is likely exceed $6-7 trillion. But all sovereign debt is not the same … and while our US National Debt is now close to $25 trillion, the “gross federal debt held by the public” is actually much smaller. And if we “net out” a few other chunks, the picture is not quite so bad. But the question remains:
Can the US afford to pay its annual interest “carry” cost on this growing mountain of debt? Let’s take a closer look.
Welcome to this week’s Steak House Index update.
If you are new to my blog, or you need a refresher on the SHI10, or its objective and methodology, I suggest you open and read the original BLOG: https://www.steakhouseindex.com/move-over-big-mac-index-here-comes-the-steak-house-index/
Why You Should Care: The US economy and US dollar are the bedrock of the world’s economy.
But is the US economy expanding or contracting?
Before COVID-19, the world’s annual GDP was about $85 trillion today. No longer. It has shrunk sizable during ‘The Great Lockdown.’ I did not coin this phrase — the IMF did. The same folks who track global GDP. Until recently, annual US GDP exceeded $21.7 trillion. Together, the U.S., the EU and China still generate about 70% of the global economic output.
The objective of this blog is singular.
It attempts to predict the direction of our GDP ahead of official economic releases. Historically, ‘personal consumption expenditures,’ or PCE, has been the largest component of US GDP growth — typically about 2/3 of all GDP growth. In fact, the majority of all GDP increases (or declines) usually results from (increases or decreases in) consumer spending. Consumer spending is clearly a critical financial metric. In all likelihood, the most important financial metric. The Steak House Index focuses right here … on the “consumer spending” metric. I intend the SHI10 is to be predictive, anticipating where the economy is going – not where it’s been.
Taking action: Keep up with this weekly BLOG update. Not only will we cover the SHI and SHI10, but we’ll explore related items of economic importance.
If the SHI10 index moves appreciably -– either showing massive improvement or significant declines –- indicating growing economic strength or a potential recession, we’ll discuss possible actions at that time.
The BLOG:
The simple answer is yes. Of course, proponents of ‘Modern Monetary Theory’ would tell you the answer is always yes regardless of the size of the mountain. You all know I’m not a fan of MMT, so I don’t agree with their conclusions. But even from my perspective, under current conditions, I believe the US can easily afford to carry our debt load. Which is a good thing because the US Treasury plans to sell a boat-load of new debt this year. You’ll recall I mentioned the US Treasury sold $20 billion of “20-year” Treasury bonds last week, something they had not done since 1986. The multiple-trillion dollar stimulus programs, both passed and planned, are expected to add trillions more to our national debt load.
But here’s where the picture gets a bit more interesting. First, there is a significant difference between our ‘National Debt’ and the ‘Debt held by the public.’ The numbers are changing quickly these days, but while the national debt is close to $25 trillion, the debt held by the public is closer to $17 trillion. What makes up the difference? ‘Intergovernmental holding’, or money one US government agency owes another. It’s complicated.
And if we “net out” the “financial assets” held by the US Government — primarily the $1.8 trillion of student loan debt owed to the federal government — it appears our net debt position is much closer to $15 trillion. A mere pittance! But wait … there’s more!
The ‘debt held by the public’ category includes debt the FED has purchased from the US Treasury. In other words, when the FED purchases Treasury securities and adds them as ‘assets’ on the FED balance sheet (the ‘cash’ paid for the securities to the Treasury is a counter-balancing liability), the US ‘public debt’ size increases. Odd, perhaps, but that’s how they do it.
The FEDs balance sheet now exceeds $7 trillion.
As of today, the FEDs assets total $7.037 trillion. About $4 trillion of that total is made up of various types of Treasury securities. But that number is certain to grow further. It’s easy to see the growing mountain. And here’s a graphic, courtesy of JP Morgan, of the current and anticipated mountain size (as a percentage of GDP:)
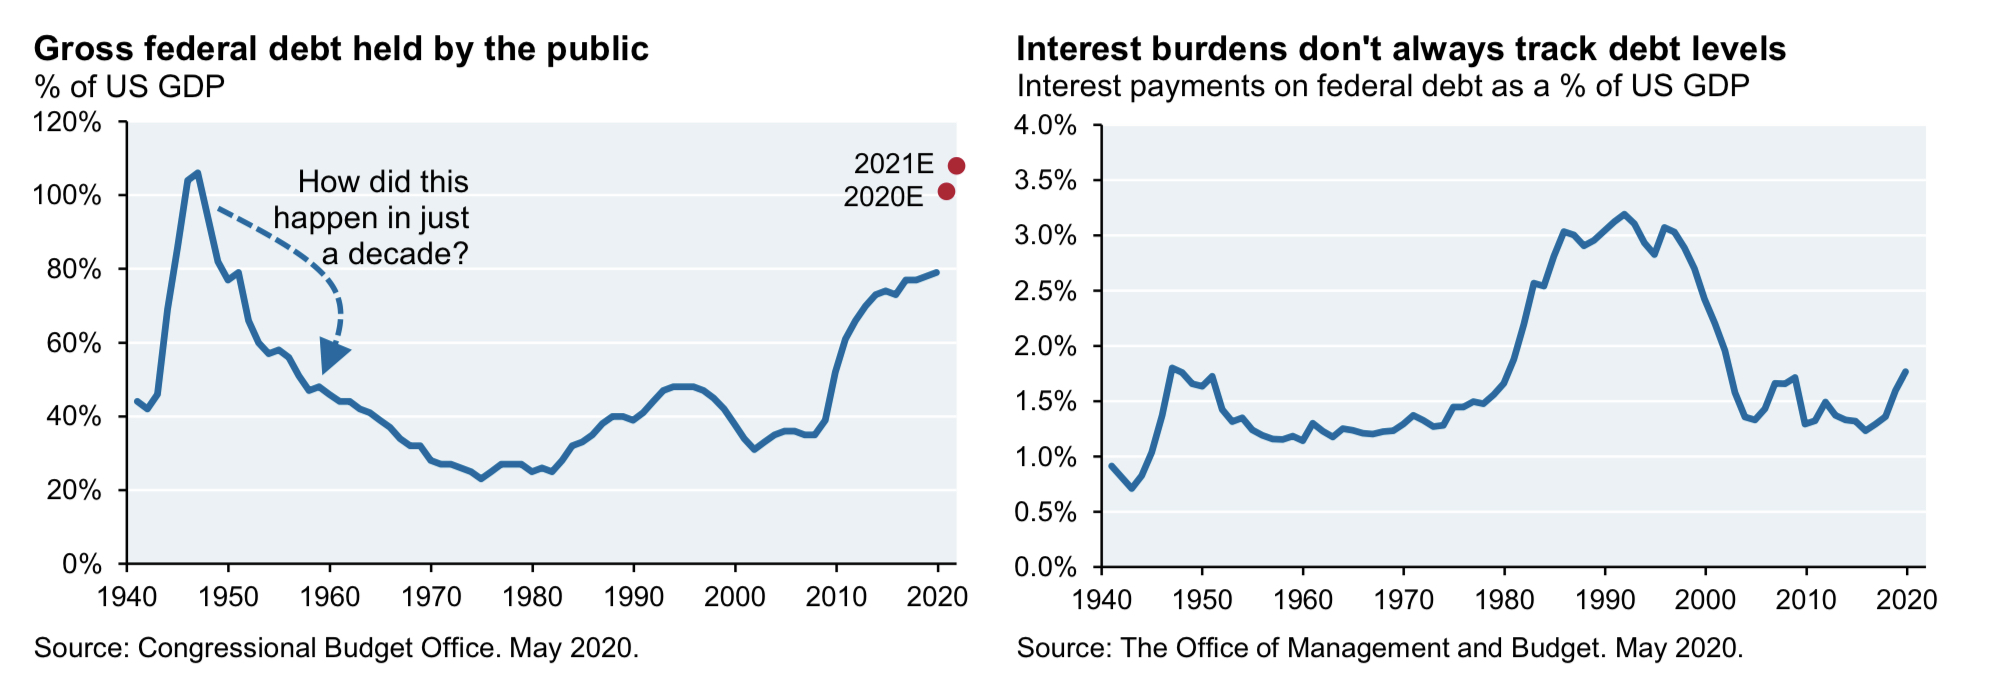
Interestingly enough, which the mountain of debt is expected to grow significantly, the “interest burden” is not. In fact, as you can see above, the interest carry cost (again, as a percentage of GDP) had been shrinking until recently. In 1990, more than 3% of our GDP was spent on the interest carry. Today the number is much smaller, well below 2%. This isn’t magic. It’s a function of interest rates. The interest bill on a 10-year Treasury at 0.7% is much lower than when that same Treasury is at 4% or more. It’s easy to see the US Treasury can easily handle the annual debt load today … as the load is actually lower than in the past.
It’s worth again mentioning that the FED owns $4 trillion of the ‘Gross federal debt held by the public’ as shown above. Clearly, one could argue US debt ‘purchased’ by the Federal Reserve should be excluded from total, in as much as Treasury securities owned by the FED — and owed by the US Treasury — seem to wash.
I mean, imagine your right hand “sold” a $10 dollar bill to your left hand. Isn’t this what’s happening here? 🙂
Regardless, after the transaction is complete, the left hand would hold $10 and the right hand would have an IOU for $10. Your “Total Body” assets would now equal $20, and liabilities, $10. But after moving the $10 bill from one hand to the other, has anything else really changed? Government accounting says yes. Agree or disagree, when the FED buys Treasury securities, crediting the Treasury with electronic cash, the Treasury debt owed to the public increases commensurately. Which is why those two “red dots” strategically placed by the economists at JP Morgan reflect a significantly higher ‘public debt’ figure forecasted by the year end.
The Treasury must finance the growing deficit. And the FED must keep interest rates low.
Over the long run, there is only way to achieve both outcomes. The FED must remain ready and willing to buy whatever amount of Treasury securities it must buy to stabilize both the market and interest rates. I’ll talk more about this below. But now, take a look at this ‘Congressional Budget Office’ (CBO) rate forecast based on FED data:
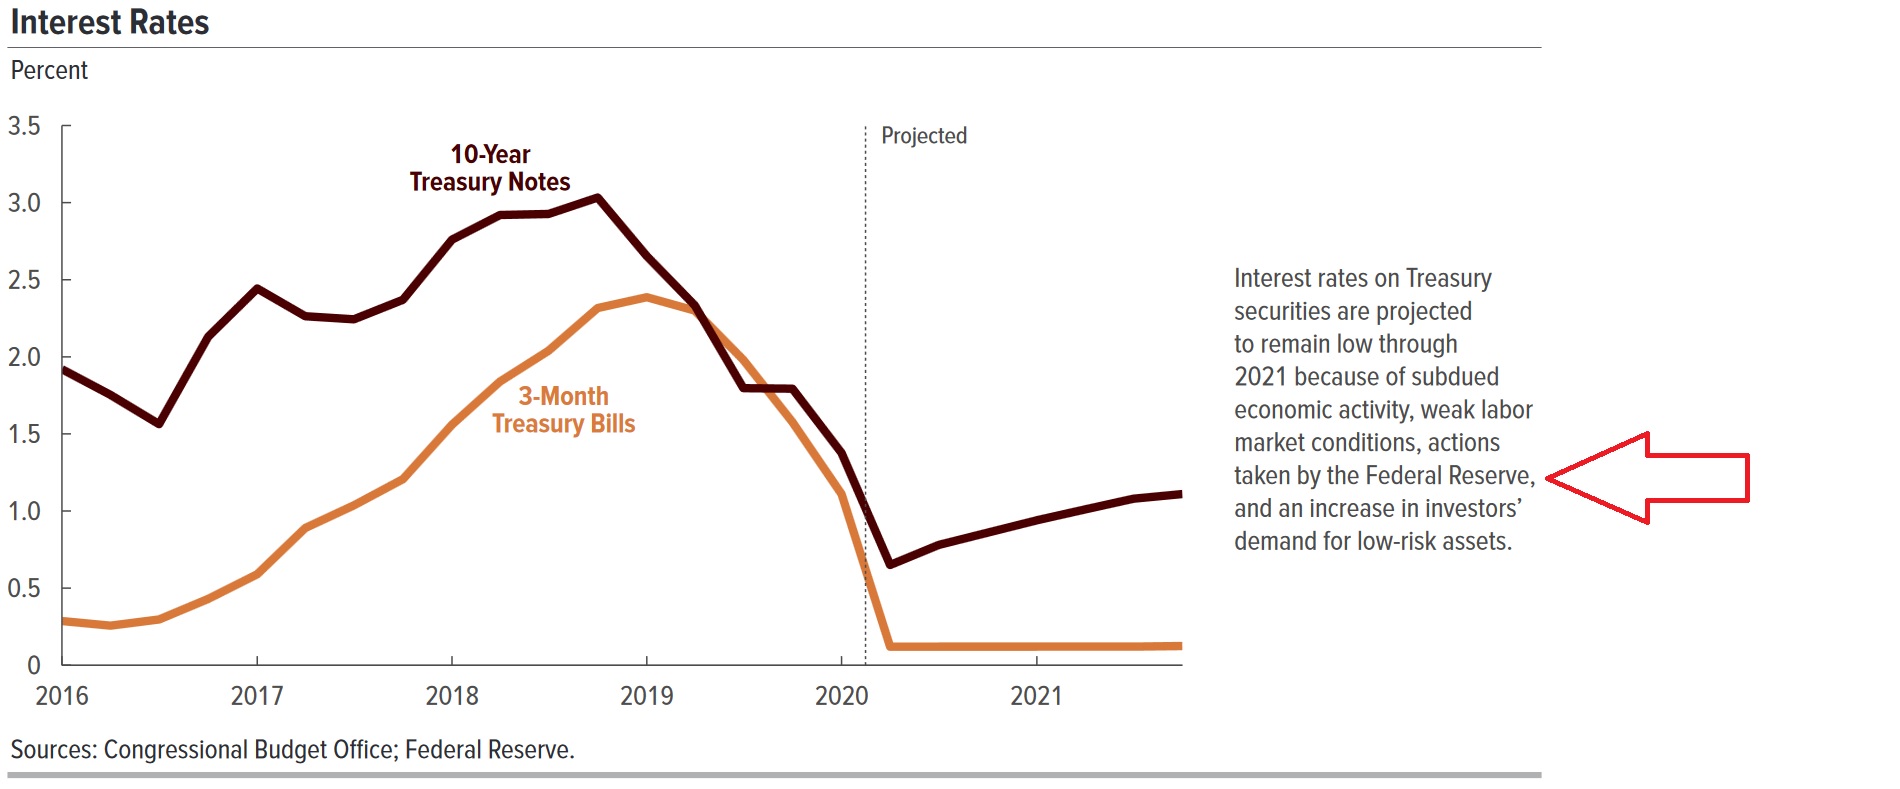
Both agencies expect the 3-month Treasury rates to remain close to zero … and the 10-year to hover around 1% (+/-). How can the FED be so confident rates will remain low? Well, because they must, to counter the severely adverse economic impacts of the Great Lockdown. The FED firmly controls rate levels through their purchase or sale of Treasury securities. The minutes from their March meeting make this clear: They are committed to preventing negative interest rates. As we know, Chairman Powell has told us the FED doesn’t believe in negative rates. Which means if bond market traders push rates in this direction, the FED must counter — buying and selling Treasuries in sufficient quantities– to push rates back to, or above, zero.
Again, the March minutes made that patently clear. Here is once comment taken from the Minutes:
“A few participants also remarked that lowering the target range to the ELB could increase the likelihood that some market interest rates would turn negative, or foster investor expectations of negative policy rates. Such expectations would run counter to participants’ (FEDs) previously expressed views that they would prefer to use other monetary policy tools to provide further accommodation at the ELB.“
‘ELB‘ is an acronym for the ‘effective lower-bound’ for short-term interest rates. The ELB is currently zero.
The FEDs other nemesis is inflation. Or, in this case, ‘negative‘ inflation. The growth in money supply notwithstanding (a different discussion), the FED is concerned deflation may rear its ugly head once again. The CBO offered this inflation forecast, once again with the FEDs assistance:
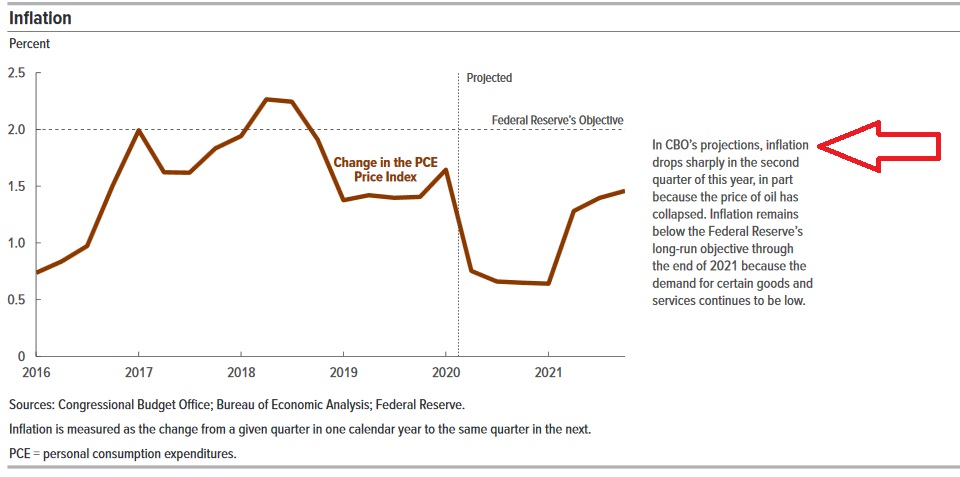
Did you see that our alphabet-soup group of government agencies is expecting the PCE to fall to as low as 0.5% during 2020? Wow … that’s a far cry from the 2% FED target. Dangerously far away, in fact. And if they’re wrong … and inflation turns negative … they have an even bigger problem. The FED will fight tooth-and-nail to prevent deflation from taking hold.
Here’s the bottom line:
Rarely do we — investors, property owners, and consumers — have this type of transparency. We know the FED must keep rates low. We know the FED must prevent deflation. We know the Treasury must sell more debt … and the FED must buy some — or all — of it, all-the-while ensuring low rates to help the economic recovery and maintain inflation levels.
Which means we probably have a year or more of these ultra-low rates during which time we should look to finance or refinance every debt we have. As I’ve said before, once the markets stabilize, I will not be surprised to see 30-year mortgage rates in the 2s.
Perhaps this is is our pandemic silver lining.
– Terry Liebman