
SHI 5.16.18 Buying Steaks and Other Stuff

SHI 5.9.18 Americans are Working!
May 9, 2018
SHI 5.23.18 Those Cracks I Mentioned?
May 23, 2018
The SHI10 is a simple consumer spending barometer.
Another more official measurement is provided monthly by the US Census Bureau in a report called “Advance Monthly Sales for Retail and Food Services,” commonly referred to as the ‘monthly retail sales’ report. The most recent version was published yesterday. According to that report, seasonally adjusted April retail sales grew to $497.6 billion, up about 0.3% from last month and almost 3.6% from April of last year. Not bad.
More interesting to me, hidden deep in the numbers, is a great measure of the “Amazon Effect.” Permit me to elaborate:
- In the 5 years from April 2013 to April 2018, total monthly retail sales grew by 21%.
- During this same 5-year period, sales in a sub-catagory called “non-store retailers” grew by 58%.
- Finally, again during the identical time period, “department stores” sales declined by over 12%.
Google defines a “non-store retailer” as a seller outside the confines of a retail facility. Amazon. The trend is clear. Retail disruption is clearly on the upswing. Anecdotally, we all knew this. But this data corroborates that belief.
The bottom line: If you plan to buy any retail REIT stocks, pick very, very carefully. I suspect there are diamonds among the glass chips, but they may be hard to find.
But I have yet to figure out how Amazon can disrupt the steak house. Until Amazon figures out how to deliver a piping hot, thick, tender and juicy Filet Mignon right to your kitchen table, I think Mastros is safe. Hmmm … perhaps drones are the answer? 🙂
Welcome to this week’s Steak House Index update.
If you are new to my blog, or you need a refresher on the SHI10, or its objective and methodology, I suggest you open and read the original BLOG: https://www.steakhouseindex.com/move-over-big-mac-index-here-comes-the-steak-house-index/
Why You Should Care: The US economy and US dollar are the bedrock of the world’s economy. This has been the case for decades … and will continue to be true for years to come.
Is the US economy expanding or contracting?
According to the IMF (the ‘International Monetary Fund’), the world’s annual GDP is almost $80 trillion today. US ‘current dollar’ GDP almost reached $20 trillion during Q1, 2018. We remain about 25% of global GDP. Other than China — a distant second at around $11 trillion — the GDP of no other country is close.
The objective of the SHI10 and this blog is simple: To predict US GDP movement ahead of official economic releases — an important objective since BEA (the ‘Bureau of Economic Analysis’) gross domestic product data is outdated the day it’s released.
Historically, ‘personal consumption expenditures,’ or PCE, has been the largest component of US GDP growth — typically about 2/3 of all GDP growth. In fact, the majority of all GDP increases (or declines) usually results from (increases or decreases in) consumer spending. Consumer spending is clearly a critical financial metric. In all likelihood, the most important financial metric.
The Steak House Index focuses right here … on the “consumer spending” metric. I intend the SHI10 is to be predictive, anticipating where the economy is going – not where it’s been.
Taking action: Keep up with this weekly BLOG update. Not only will we cover the SHI and SHI10, but we’ll explore related items of economic importance.
If the SHI10 index moves appreciably -– either showing massive improvement or significant declines –- indicating growing economic strength or a potential recession, we’ll discuss possible actions at that time.
The BLOG:
Like the Economist’s “Big Mac Index,” our beloved Steak House Index was never intended to be a precise gauge. Clearly it offers a more anecdotal result than a precise measurement. But just like the Big Mac Index, therein lies the inherent value of the SHI: It offers a forecast whereas a precise measurement can only occur with historic data.
One great historic economic data source is the FED‘s “Beige Book” published 8 times per year. Each of the 12 federal reserve districts report on economic activity within their region:
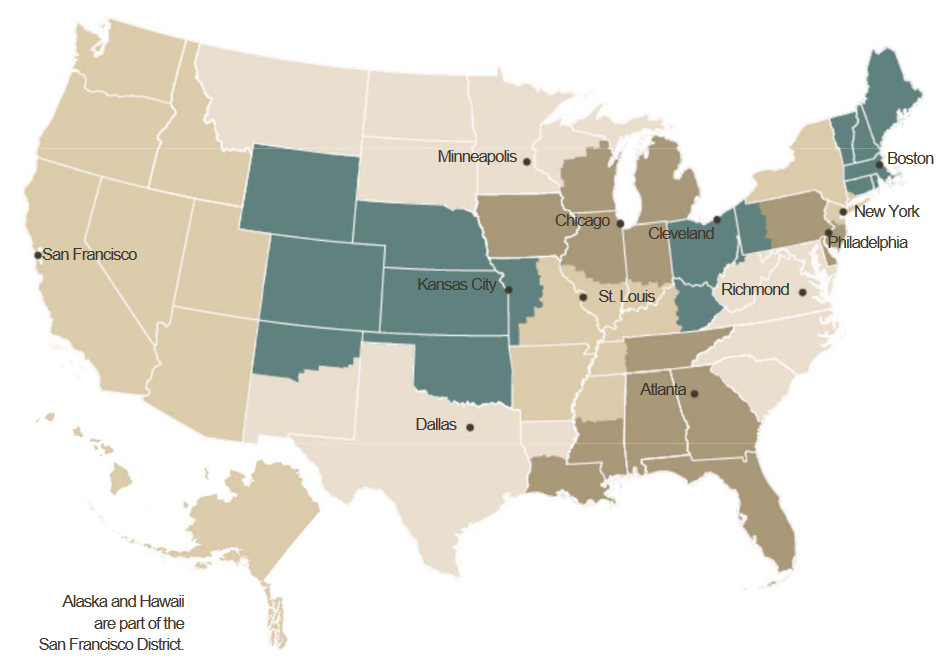
Our SHI10 draws from 10 cities, 6 of which house a Federal Reserve Bank headquarters:
- Dallas
- Chicago
- St Louis
- New York
- Boston
- Philadelphia
While the “OC” isn’t in San Francisco, it’s close enough. So like the FED districts, the SHI10 covers a lot of real estate. The diversified nature of our index data increases accuracy. In theory. So let’s take a bite into this week’s data:
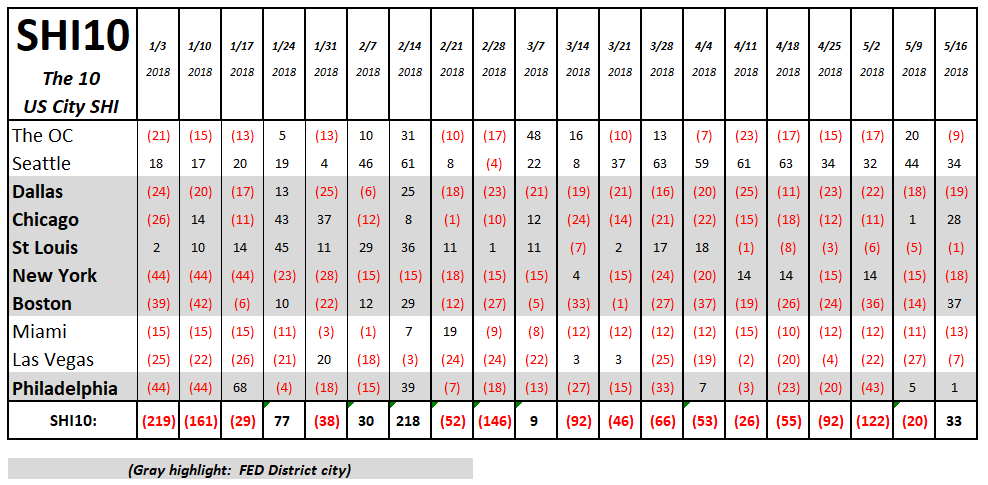
Our long-term SHI10 trend analysis tells us steaks are in high demand! While reservation demand cooled slightly in Seattle, both Chicago and Boston show dramatic improvement this week. As we can see from this weeks detail report, reservation demand for this Saturday is quite strong across the geographic board:
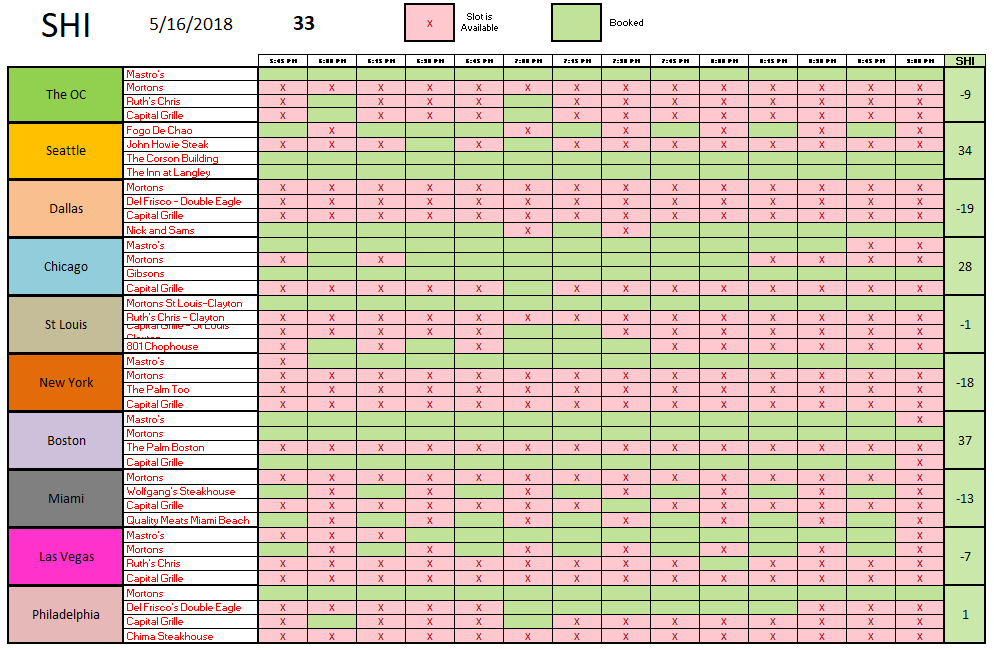
Here in the OC, Mastros is completely booked. Nothing new there. But even the Capital Grille has 2 booked time slots! Across the other 9 markets it’s easy to see reservation demand is high. The only exception, perhaps, is Miami.
With an SHI10 reading of 33, and a continuing improving weekly trend, our SHI suggests consumer spending remains elevated and the US economy remains robust.
As mentioned in prior blogs, economic growth here in the US and globally faces a few headwinds. Issues such as the rising 10-year Treasury yield, GDP weakness in the euro zone, an increasing US dollar index, suggest change is coming down the road. How soon and to what extent is anyone’s guess.
Bill Gross is well respected and likes to make forecasts. He once commented that in the prior 15 years ending in 2007, in each instance where the FED funds rate was higher than the nominal GDP growth rate, assets (values) such as stocks and housing fell. Remember, nominal GDP growth is quite strong right now — the most recent reading was about 4.76% and the ‘effective’ FED funds rate is currently 1.69%:
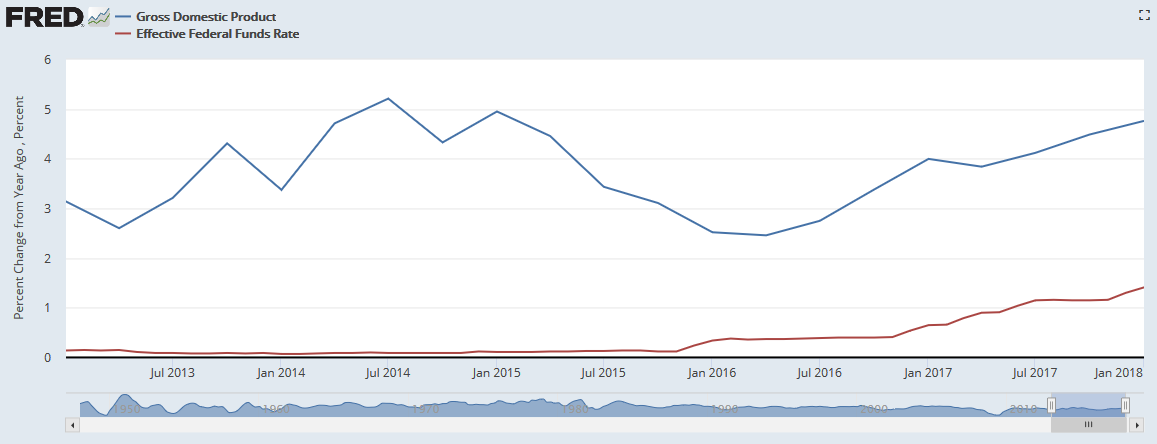
At this moment, nominal GDP growth is far above the FED funds rate. Of course, the FED does plan to raise rates again. Something to watch.
But I’m sure Bill would agree: As long as GDP (both real and nominal) growth remain robust and far above the FED funds rate, asset values are safe!
Finally, I wanted to let you all know I will be conducting “on-site” market research next week: I’m heading to Mastros! 🙂
– Terry Liebman

