
SHI 4.8.20 – Musicians, Hotel Rooms, Employment, China and the FED

SHI 4.1.20 – April Fools Day
April 1, 2020
SHI 4.15.20 – FOMO and LOCO in the Great Lockdown
April 15, 2020
“Not even Keith Richards or Jim Morrison could have trashed the hotel sector as much as the novel coronavirus.”
Far and away, this is my “favorite” quote so far. Funny, spot on, and of course very sad. Because as we all know, the jobs of very hard working folks in the “Leisure and Hospitality” segment of our economy have been trashed. And so have hotel owners. Empty hotels trash the owners too.
Musicians today no longer trash hotel rooms. Quite the opposite. Earlier this week, I watched a a number of huge country music stars perform, I believe as a public service without compensation, on a prime-time TV program. The program, and the performers, did a great job of sharing messages of hope, love, tenacity, and togetherness. It was a welcome change from the continuously negative news we have all been watching.
Unemployment has soared. How bad is it right now? We’ll take a look. And go a few steps further into speculation: How bad will it get? And, of course, let’s investigate what “recovery” might look like.
Welcome to this week’s Steak House Index update.
If you are new to my blog, or you need a refresher on the SHI10, or its objective and methodology, I suggest you open and read the original BLOG: https://www.steakhouseindex.com/move-over-big-mac-index-here-comes-the-steak-house-index/
Why You Should Care: The US economy and US dollar are the bedrock of the world’s economy.
But is the US economy expanding or contracting?
According to the IMF (the ‘International Monetary Fund’), the world’s annual GDP is about $85 trillion today. According to the most recent estimate, US ‘current dollar’ GDP now exceeds $21.7 trillion. In Q4 of 2019, first estimates suggest nominal GDP grew by 3.6%, following a 3.5% annualized growth rate in Q3. The US still produces about 25% of global GDP. Other than China — in a distant ‘second place’ at around $13 trillion — the GDP of no other country is close. In fact, the GDP output of the 28 countries of the ‘European Union’ has fallen behind, collectively now almost $2 trillion less that US GDP. Together, the U.S., the EU and China still generate about 70% of the global economic output.
The objective of this blog is singular.
It attempts to predict the direction of our GDP ahead of official economic releases. Historically, ‘personal consumption expenditures,’ or PCE, has been the largest component of US GDP growth — typically about 2/3 of all GDP growth. In fact, the majority of all GDP increases (or declines) usually results from (increases or decreases in) consumer spending. Consumer spending is clearly a critical financial metric. In all likelihood, the most important financial metric. The Steak House Index focuses right here … on the “consumer spending” metric. I intend the SHI10 is to be predictive, anticipating where the economy is going – not where it’s been.
Taking action: Keep up with this weekly BLOG update. Not only will we cover the SHI and SHI10, but we’ll explore related items of economic importance.
If the SHI10 index moves appreciably -– either showing massive improvement or significant declines –- indicating growing economic strength or a potential recession, we’ll discuss possible actions at that time.
The BLOG:
Trashed. A great one-word summary for the damage to the hotel sector, our civilian labor force, and our economy at large. Trashed. No, a heavy metal band from the ’70s or ’80s couldn’t have done more damage CV19.
Talking about employment, the BEA ‘Situation Report’ published last Friday was dismal. Not as dismal as it will become, of course, but dismal enough. The hardest hit, far and away, was the food and hotel segment. Called ‘Leisure and Hospitality,’ in the BEA report, the one month employment decline was 459,000 people. Total job losses were 701,000, so about 65% of all job losses were in this segment. Of course, we all know this: Our favorite restaurants are closed, entertainment is stopped, and hotels are mostly empty. Even worse, this report probably does not capture the full extent of employment damage we’re likely to see. No, unfortunately, it will likely get much worse. How much worse? Well, that’s speculation, but it depends on who you ask. If you ask the economists over at Goldman Sachs, they believe the unemployment rate will peak at 30%. This is the largest number I’ve seen. Other forecasts are lower, ranging from about 25% down to 15%.
Remember, going into this mess, the US unemployment rate was 3.5%. And Goldman thinks this rate will rise to 30%. Staggering. It’s important to understand what these percentages mean. So here are a few data points to help put this into context:
- US Civilian Labor Force in February, 2020: 164.5 million Americans
- Employed in February, 2020: 158.7 million
- Unemployed in February, 2020: 5.8 million
Let’s convert Goldman’s 30% figure into a number. If Goldman is right, then just under 50 million Americans will be unemployed at the peak. 50 million. Boy, I hope they are wrong. That would be horrible. But so would a 15% unemployment rate. 15% translates to 25 million unemployed Americans. 25 million. Staggering. By comparison, consider the unemployment rate in October of 2009, at the peak of job losses during the “Great Recession.” In total, we peaked at a 10% unemployment rate in October of 2009. How bad was unemployment during the Great Depression of the 1930s? Great question. Unfortunately, statistical data from the 1930s is a bit sketchy. And the definition of unemployment itself was different at that time. But the best estimate is a 24.9% unemployment rate, peaking in 1933.
The rate is one thing. Another is the duration. We all know millions of hard working folks will lose their jobs from this debacle. We can only hope the duration will be very short — months instead of years.
It will come as no surprise that optimism about the future has been trashed, too. According to a recent NY FED blog, “Coronavirus Outbreak Sends Consumer Expectations Plummeting.” Job losses and fear will do that. How bad is the plunge? Unsurprisingly, pretty bad:
- The March survey, which was fielded between March 2 and 31, records a substantial deterioration in financial and economic expectations, including sharp declines in household income and spending growth expectations.
- As shown in the first two columns of the table below, the median expected year-ahead growth in income and spending declined from 2.7 percent and 3.1 percent in February to 2.1 percent and 2.3 percent in March, respectively.
- Similarly, expectations about home price growth plunged from 3.1 percent in February to 1.3 percent in March. The March reading for one-year home price growth expectations came in about 1.4 percentage points below the previous low for the series, which stretches back to June 2013.
If you’re interested, here’s the entire chart from the survey (right click, open in a new window):
The FED ‘minutes’ from their 3/15 meeting were released this morning. You will recall the FED minutes reflect the actual discussions by and between the FOMC members at the meeting. Permit me to summarize the highlights from the minutes:
BEFORE COVID-19:
- Labor market conditions had remained strong through February;
- real gross domestic product (GDP) appeared to have been increasing at a moderate pace in the first two months of the year; and
- consumer price inflation, as measured by price index for personal consumption expenditures (PCE), remained below 2 percent in January.
IMPACT OF COVID-19
- Concerns about the coronavirus outbreak dominated financial market developments at home and abroad over the inter-meeting period.
- Equity prices, sovereign yields, and the market-implied expected trajectory of the federal funds rate all plummeted
- Short-term funding markets showed signs of stress, with elevated demand for repo funding and increased short-term spreads.
- Trading conditions for Treasury securities and MBS were impaired.
- Moreover, primary issuance of investment-grade corporate bonds was sporadic,
- and that of speculative-grade corporate bonds and leveraged loans virtually stopped after late February.
- Yields on nominal Treasury securities plummeted across the maturity spectrum, with the 10- and 30-year yields reaching all-time lows at some point.
- Measures of inflation compensation based on Treasury Inflation-Protected Securities fell sharply and reached a historical low.
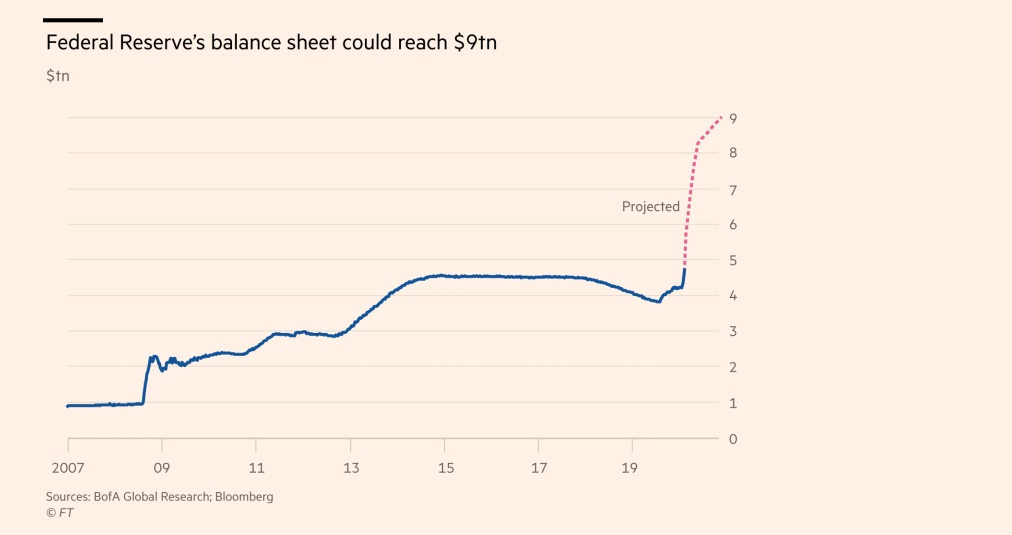
That tells the financial story. And we now have a view of the reasons behind the FEDs recent actions and choices. One of which was to use the FEDs balance sheet as a funding source for a number of existing and novel programs, all focused on ensuring the US and global financial markets function properly. You’ll recall the FED was previously focused on shrinking the balance sheet. In August of 2019, it was down to a paltry $3.8 trillion. On April 1, 2020, it had swelled to just over $5.8 trillion. And it won’t stop there. The London Financial Times believes it might grow to over $9 trillion before this episode is over.
Clearly, the FED and the Treasury are doing all they can to minimize the impact of the shutdown. Their efforts are extensive, and at the same time imperfect. But they are impressive nonetheless.
How bad will it get? When will the US economy recover?
Again, it depends on who you ask. Will the “shut-down” end here in the US by April 30? Probably not. Perhaps in some regions, but in others, probably not. The “European Centre for Disease Prevention and Control” is the CDC equivalent in the EU. Every day, they produce a CV19 data set second to none, all downloadable into an EXCEL spreadsheet. The start date for data in each country is 12/31/19. Here’s the link if you’re interested (remember, right click/open in a new tab):
https://www.ecdc.europa.eu/en/geographical-distribution-2019-ncov-cases
Data for the United States begins on line 9289 (December 31, 2019) and spans to line 9190 (March 8, 2020). On 12/31/19, the US had zero cases of CV19. According to the ECDC data, the first US case showed up on 1/21/2020 — about 10 weeks ago. Our first death occurred on 3/1/2020. On 12/31/19, China already had 27 active cases. The first death in China occurred on 1/11/2020. Their peak in daily new cases was around 2/10/20. The peak was about 4,000 new daily cases. From 3/8/2020 thru today, China has had about 100 daily new cases.
South Korea reported their first case on 1/20/2020. The first death in South Korea occurred on 2/21/2020. Their peak in daily new cases was around 3/3/20. The peak was about 600 cases per day. From 4/3/2020 thru today, South Korea is averaging less than 100 daily new cases.
What does this data tell us? Well, it depends on whether or not you believe China’s data. If you do, and if another country were to take the extraordinary steps that China took, the time from the first CV19 death to having control over the virus is about 2 months. But other countries have not emulated China. Nor can or will they. Interestingly, the South Korean outcome resolved in less than 2 months. Of course, these stories are not complete … and further outbreaks could follow. This aside, if we use the “2-month” metric as gauge, this suggests 2 months after the first US death — 3/1/2020 — the US might have CV19 under control. By 5/1/2020. Might. This is a very rough, imprecise, untested metric and methodology. More of a guess, really, than anything else. But, nonetheless, a lens we might use for forecasting. How are other countries progressing?
- France: 1st death – 2/15 … peak daily new cases – 4/1 …
- Italy: 1st death – 2/23 … peak daily new cases – 3/22 …
- Spain: 1st death – 3/5 … peak daily new cases – 4/1 …
- UK: 1st death – 3/6 … peak daily new cases – 4/4 …
- Germany: 1st death – 3/10 … peak daily new cases – 4/3 …
So, might the developed countries of Europe be “back to work” by some time in May? Perhaps.
On the other hand, daily new cases in the US as a whole do not seem to have peaked. Some states seem to have peaked, for example, California, but not the US in total. Here’s a California graphic courtesy of the LA Times, updated on 4/8/2020 at 1:04 pacific time:
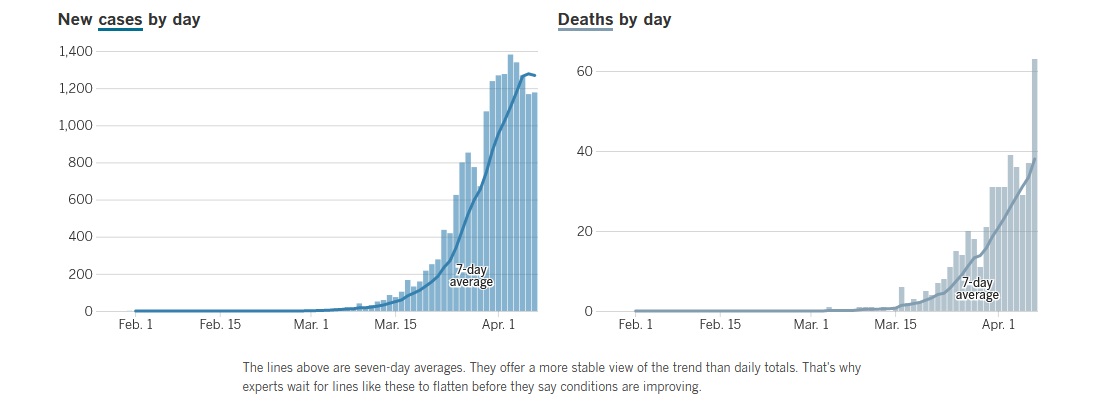
It appears to me the daily new cases “peak” in California was April 1. Could California be “back to work” by May 1st? Perhaps.
And what does “back to work” even mean? That’s an even harder question to answer. It might mean that on May 1, the citizens of California are free to move about and go to work. Will movie theaters be open? Will professional sporting events begin again? Will restaurants open?
Again, perhaps. But I have no doubt there we will still be under serious restrictions:
- As fever is a tell-tale sign, temperature checks will become commonplace at facility entrances;
- Per CDC “suggestion,” everyone in public must wear a face/nose covering to prevent any positive and asymptomatic person from spreading the virus;
- Everyone will be asked to maintain some amount of social distancing;
- Hand-washing will be enforced.
And sick folks will not be tolerated in public.
China. Wow. Conspiracy theories abound. Crazy. Many believe, at the minimum, their data is false … that they haven’t recovered from the outbreak. Rest assured, I’m not a big believer in statistics originating in China. Call me a cynic, but I question their accuracy. A number of people I know agree. And a few have opined that the “Chinese recover” from CV19 is misinformation … not true … simply more questionable statistics out of China. I would counter with a somewhat tepid comment that the “numbers” we see are generated by the World Health Organization (WHO), not China. Perhaps.
Maybe this will convince skeptics. Take a look at the two photos below … courtesy of the International Monetary Fund (IMF) and the European Space Agency:
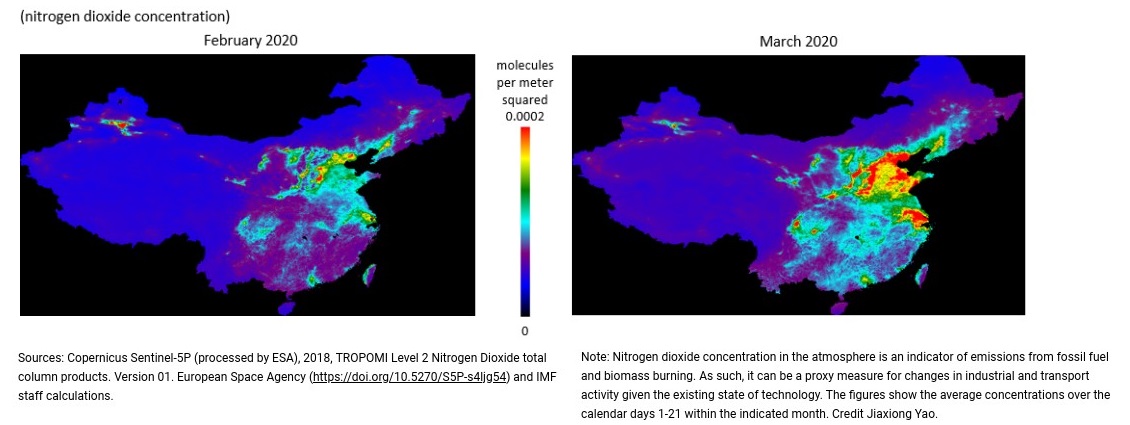
Clearly, the air in China is less clear in March than in February. Air pollution is back. In just one month. The data is irrefutable: Autos and industry are back at work in China. Will parts of the US follow a similar path by May 1st? You decide.
– Terry Liebman


1 Comment
Will California go back to no restrictions by May 1st?
Answer: No
Reason: Gavin Newsom wants to run for President. If too many people die, he will be blamed. If he keeps everything shut down for longer, no matter what happens he won’t be blamed.
So much for my small business that employs 48 people (lots of part-timers, about 18 FTEs). We will remain shut down. What happens to that business? Newsom will run for President no matter what happens to my business.