
SHI 4.10.19 – Steaks, Nighttime Lights and the GDP

SHI 4.3.19 — Inversion Reversion, Fear and Loathing
April 3, 2019
SHI 4.17.19 – The FED: Quantitative Neutrality
April 17, 2019
“This just in: At night, it is really dark in Malawi.”
Shocking, right? Who knew?
We can thank Yingyao Hu and Jiaxiong Yao of the International Monetary Fund (IMF) for this groundbreaking revelation. What does this have to do with economics and GDP? Well, in their new research, Mr. Hu and Mr. Yao use nighttime light intensity — observed by satelites — to enhance and increase GDP measurement accuracy in low-growth, third-world countries.
And to prove they have a sense of humor, they entitled the paper, “Illuminating Economic Growth.” See what they did there? Pretty funny, right? Who said economists don’t have a sense of humor! Hah!
Here at the SHI we use high-priced steaks in our high-growth, developed economy; in Malawi, nighttime lights. Works for me! 🙂
Welcome to this week’s Steak House Index update.
If you are new to my blog, or you need a refresher on the SHI10, or its objective and methodology, I suggest you open and read the original BLOG: https://www.steakhouseindex.com/move-over-big-mac-index-here-comes-the-steak-house-index/
Why You Should Care: The US economy and US dollar are the bedrock of the world’s economy. This has been the case for decades … and will be true for years to come.
But is the US economy expanding or contracting?
According to the IMF (the ‘International Monetary Fund’), the world’s annual GDP is about $80 trillion today. US ‘current dollar’ GDP now exceeds $20.89 trillion. In Q4 of 2018, nominal GDP grew by 4.6%…following a 4.9% increase in Q3. We remain about 25% of global GDP. Other than China — a distant second at around $12 trillion — the GDP of no other country is close. We can’t forget about the EU — collectively their GDP almost equals the U.S. So, together, the U.S., the EU and China generate about 2/3 of the globe’s economic output. Worth watching, right?
The objective of the SHI10 and this blog is simple: To predict US GDP movement ahead of official economic releases — an important objective since BEA (the ‘Bureau of Economic Analysis’) gross domestic product data is outdated the day it’s released. Historically, ‘personal consumption expenditures,’ or PCE, has been the largest component of US GDP growth — typically about 2/3 of all GDP growth. In fact, the majority of all GDP increases (or declines) usually results from (increases or decreases in) consumer spending. Consumer spending is clearly a critical financial metric. In all likelihood, the most important financial metric. The Steak House Index focuses right here … on the “consumer spending” metric. I intend the SHI10 is to be predictive, anticipating where the economy is going – not where it’s been.
Taking action: Keep up with this weekly BLOG update. Not only will we cover the SHI and SHI10, but we’ll explore related items of economic importance.
If the SHI10 index moves appreciably -– either showing massive improvement or significant declines –- indicating growing economic strength or a potential recession, we’ll discuss possible actions at that time.
The BLOG:
Perhaps this ‘nighttime lights’ theory isn’t all that new. A few years ago, Stanford University completed a study, described in an article entitled “Stanford researchers use dark of night and machine learning to shed light on global poverty,” on a very similar topic: Poverty. From that article, this quote:
“A new poverty mapping-technique developed by interdisciplinary researchers at Stanford offers cause for hope. The technique is based on millions of high-resolution satellite images of likely poverty zones. To analyze these images, the researchers used machine learning, a discipline within the broader field of artificial intelligence.”
Their theory: In the case of poverty mapping, the model used daytime imagery to predict the distribution and intensity of nighttime lights – and hence relative prosperity. Here’s the entire article: https://news.stanford.edu/2016/02/24/satellite-map-poverty-022416/
Using similar data, the IMF researchers suggest nighttime lights observed by satellite — or the lack thereof — can also help predict changes in GDP growth when other data sources may be absent or spotty. Measuring pricey eatery steak reservations won’t work here: The countries in question are too poor to have a steakhouse, let alone one like Mastros. The citizens can barely afford an electric bill, let alone a $160 Tomahawk, ‘bone-in’ ribeye.
It is interesting, however, that in both instances — nighttime lights and expensive steakhouse reservations — non-financial/non-economic data is being used to gain perspective and alternative viewpoints on economic performance. For you hearty souls looking to dive into some very opaque data, here you go:
The rest of us will head to Mastros and enjoy a piping hot steak and a bottle of ’82 Chateau Petrus.
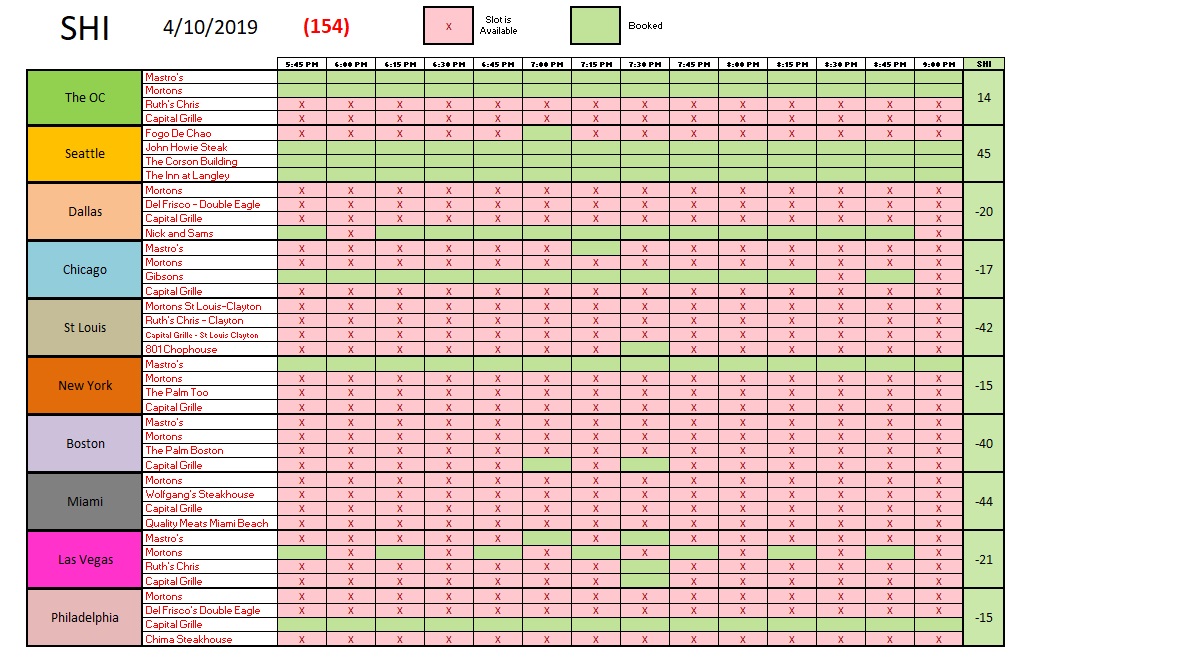
It’s a good thing we’re heading to Mastros this weekend, because reservation demand is down again this week, when compared to the same week in 2018:
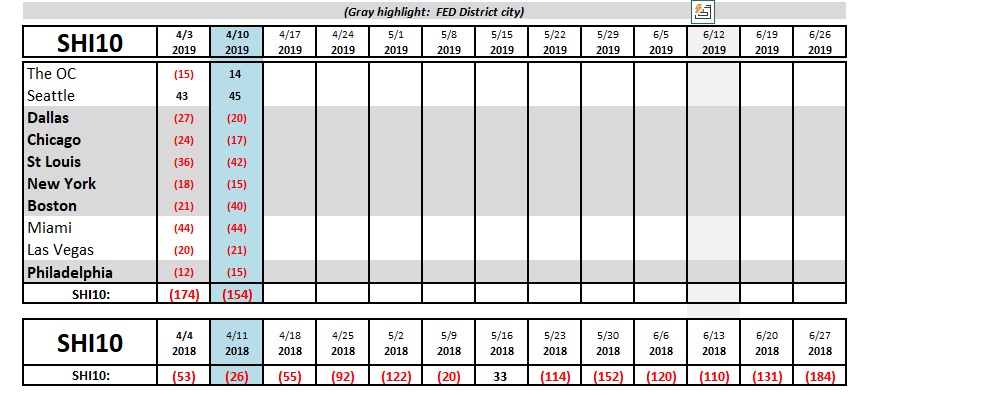
Last year, the SHI10 reading was (26). Today, reservation demand generated a far weaker SHI10 reading of (156). For a month now, reservation demand at our 40 pricey eateries has been far weaker than last year. Here are this week’s results:
The SHI is telling us something: Across the U.S., affluent consumers, in the aggregate, are reducing their expenditures at very expensive restaurants. As the SHI is a proxy for the consumer spending component of GDP, the message is consumer spending is slowing. And by extension, the U.S. economy is slowing.
Permit me to close with this comment.
If you are a consistent reader of my blog, you are familiar with JOLT report released by the Bureau of Labor Statistics (BLS). JOLT — an acronym for ‘Job Openings and Labor Turnover‘ — comes out monthly. It’s worth following because the its another barometer for the health of the labor market. In January, the number of open jobs seeking an employee had reached an all-time high: over 7.6 million. Let me put this in perspective. The ‘civilian labor force’ here in the U.S. is about 163 million. So, when measured against the total number of potential workers, about 4.6% of jobs were still seeking employees.
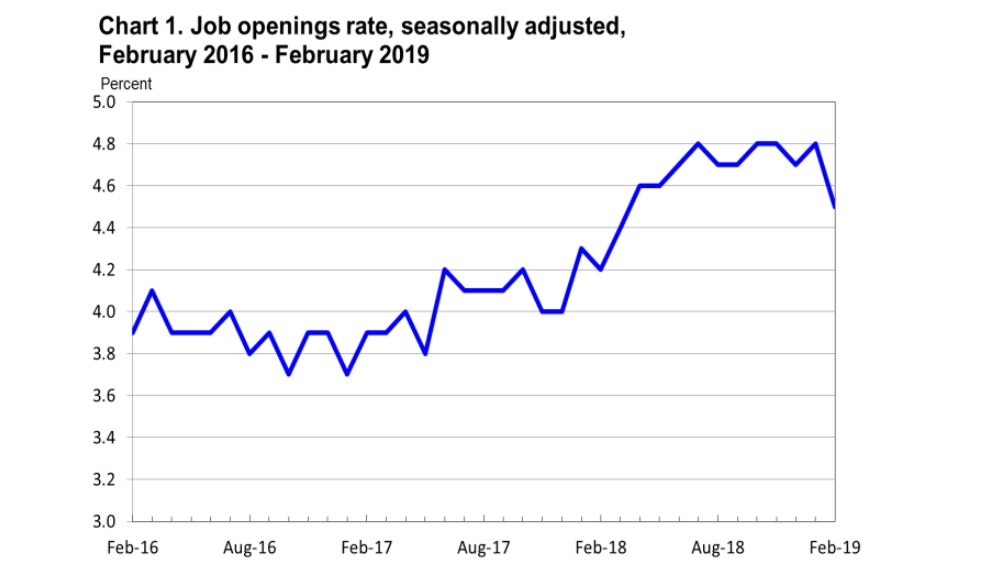
In February, that number dipped down to about 7.1 million — a decline of 538,000 open jobs (see the chart above). In a month when only 20,000 new jobs were added, this data tells us employers terminated 500,000 job offerings during February. Meaningful? Perhaps. February employment numbers may simply be an aberration. If the next JOLT report rebounds, we’ll consider it an aberration. If not … well, then, it’s another indication of our S L O W I N G economy.
What does this mean for you? Simply this: When making business or investment decisions where outcomes are correlated with economic activity, be cautious. 2-4 years out, our economy and GDP growth may be much slower than today.
– Terry Liebman


2 Comments
Terry. I really enjoyed reading this. You make a lot of interesting/good points and done with humor.
I would like to receive your blob posts going forward.
Note my new email account I am starting to use since my firstam.com email will be going away the end of May. I will still use my Lidoparkplace.com email while I am on our HOA Board. Thanks for coming by for lunch and a chat. I enjoyed both very much!
Thanks Larry. I’ll get you registered to get the weekly link.
– T