
SHI 2.26.20 – Reaching New Lows

SHI 2.19.2020 – Confirmation Bias
February 19, 2020
SHI 3.4.20 – Welcome to California, Comrade
March 4, 2020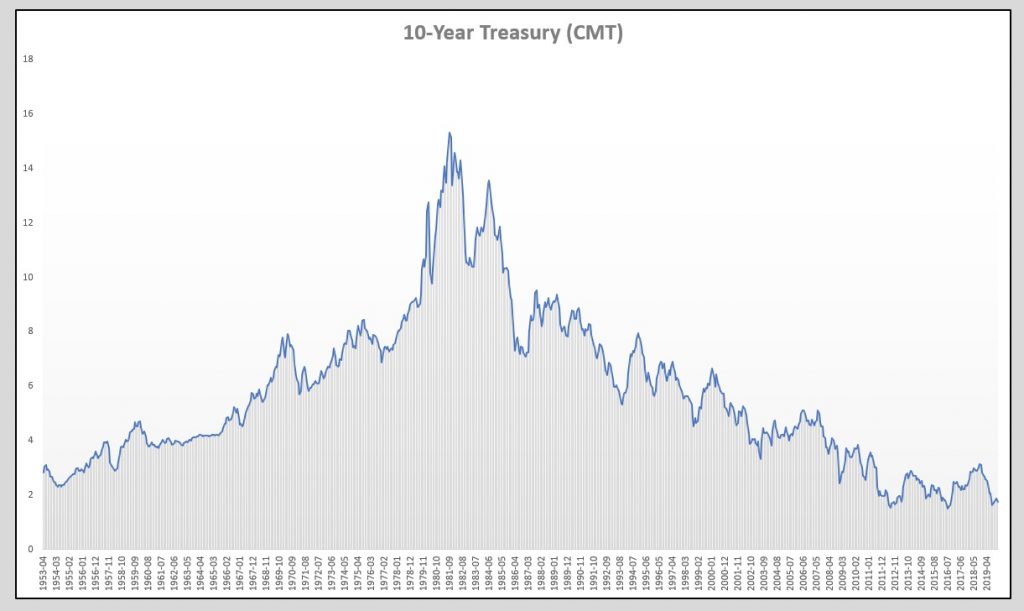
“The 10-Year Treasury interest rate set a record on Tuesday.”
It set a new low-water mark, closing at 1.328%. This is a new record low. Never before, in the 230-year history of US interest rates, has the 10-year Treasury rate closed that low. And rest assured, there’s a lot of history here. US Treasuries were first issued by the Secretary of the Treasury, Alexander Hamilton, in the year 1790 — 230 years ago.
Where will rates go from here? Is it time to refinance your house?
Read on.
Welcome to this week’s Steak House Index update.
If you are new to my blog, or you need a refresher on the SHI10, or its objective and methodology, I suggest you open and read the original BLOG: https://www.steakhouseindex.com/move-over-big-mac-index-here-comes-the-steak-house-index/
Why You Should Care: The US economy and US dollar are the bedrock of the world’s economy.
But is the US economy expanding or contracting?
According to the IMF (the ‘International Monetary Fund’), the world’s annual GDP is about $85 trillion today. According to the most recent estimate, US ‘current dollar’ GDP now exceeds $21.7 trillion. In Q4 of 2019, first estimates suggest nominal GDP grew by 3.6%, following a 3.5% annualized growth rate in Q3. The US still produces about 25% of global GDP. Other than China — in a distant ‘second place’ at around $13 trillion — the GDP of no other country is close. In fact, the GDP output of the 28 countries of the ‘European Union’ has fallen behind, collectively now almost $2 trillion less that US GDP. Together, the U.S., the EU and China still generate about 70% of the global economic output.
The objective of this blog is singular.
It attempts to predict the direction of our GDP ahead of official economic releases. Historically, ‘personal consumption expenditures,’ or PCE, has been the largest component of US GDP growth — typically about 2/3 of all GDP growth. In fact, the majority of all GDP increases (or declines) usually results from (increases or decreases in) consumer spending. Consumer spending is clearly a critical financial metric. In all likelihood, the most important financial metric. The Steak House Index focuses right here … on the “consumer spending” metric. I intend the SHI10 is to be predictive, anticipating where the economy is going – not where it’s been.
Taking action: Keep up with this weekly BLOG update. Not only will we cover the SHI and SHI10, but we’ll explore related items of economic importance.
If the SHI10 index moves appreciably -– either showing massive improvement or significant declines –- indicating growing economic strength or a potential recession, we’ll discuss possible actions at that time.
The BLOG:
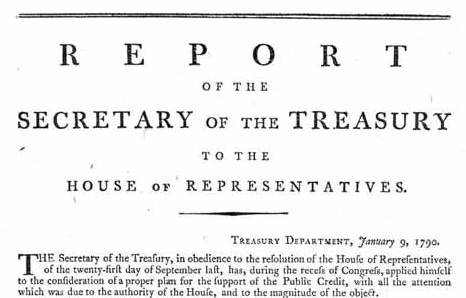
On January 9, 1790, by request from the first US House of Representatives, Alexander Hamilton, the first Secretary of the US Treasury, prepared a report suggesting the brand-new US government, formed in 1789, “nationalize” the debts incurred by the colonies “state war-incurred debts” and issue federal securities in exchange. These securities were the first Treasury securities ever issued.
The interest rate was 6% per year, and the authorized total US debt — $21.5 million — paid off the state debts:
- New Hampshire – $300,000
- Massachusetts – $4,000,000
- Rhode Island and Providence Plantations – $200,000
- Connecticut – $1,600,000
- New York – $1,200,000
- New Jersey – $800,000
- Pennsylvania – $2,200,000
- Delaware – $200,000
- Maryland – $800,000
- Virginia – $3,500,000
- North Carolina – $2,400,000
- South Carolina – $4,000,000
- Georgia – $300,000
I find it amazing that in 230 years, our national debt has ballooned from $21.5 million to about $22 trillion. But that’s just me. Perhaps I amaze easily. 🙂
On the other hand, while the debt level is significantly higher, the general level of interest rates today is lower than back in 1790. This is true for the 10-year Treasury, too. Here’s the best chart I could scrounge up from the internet that tracks rates going back to 1790, pulled from a 2015 article in Business Insider:
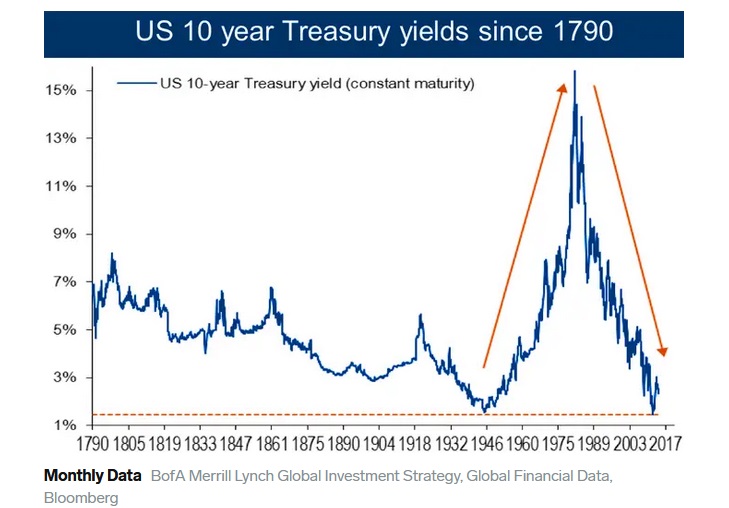
Of course, the above chart only shows data thru 2015. And while I am confident the chart is accurate, I am unable to confirm the source data. This aside, it generally conforms with my research, and I have no doubt Harnett’s data is accurate. The Business Insider article included these high-level rate comment:
- 1790-1902: erratic yield fluctuations and then a sustained decline in yields to below 3%.
- 1902-1920: the First Bear Bond Market, yields rise from 3% to 5-6%.
- 1920-1946: the Great Bull Bond Market, yields decline from 5-6% to below 2%.
- 1946-1981: the Second Bear Bond Market, yields soar from 2% to above 15% during 1981.
- 1981-2012: the Greatest Bull Bond Market, as yields tumble from 15% to 1.4% in 2012.
Remember, when the US was a brand new country, its securities were much riskier than they are today. So it’s no surprise we saw “erratic yield fluctuations” between 1790 and 1902.
The chart below, however, is 100% accurate and verified. I sourced the data from the Federal Reserve, to the beginning of their records back to April of 1953. Take a look:
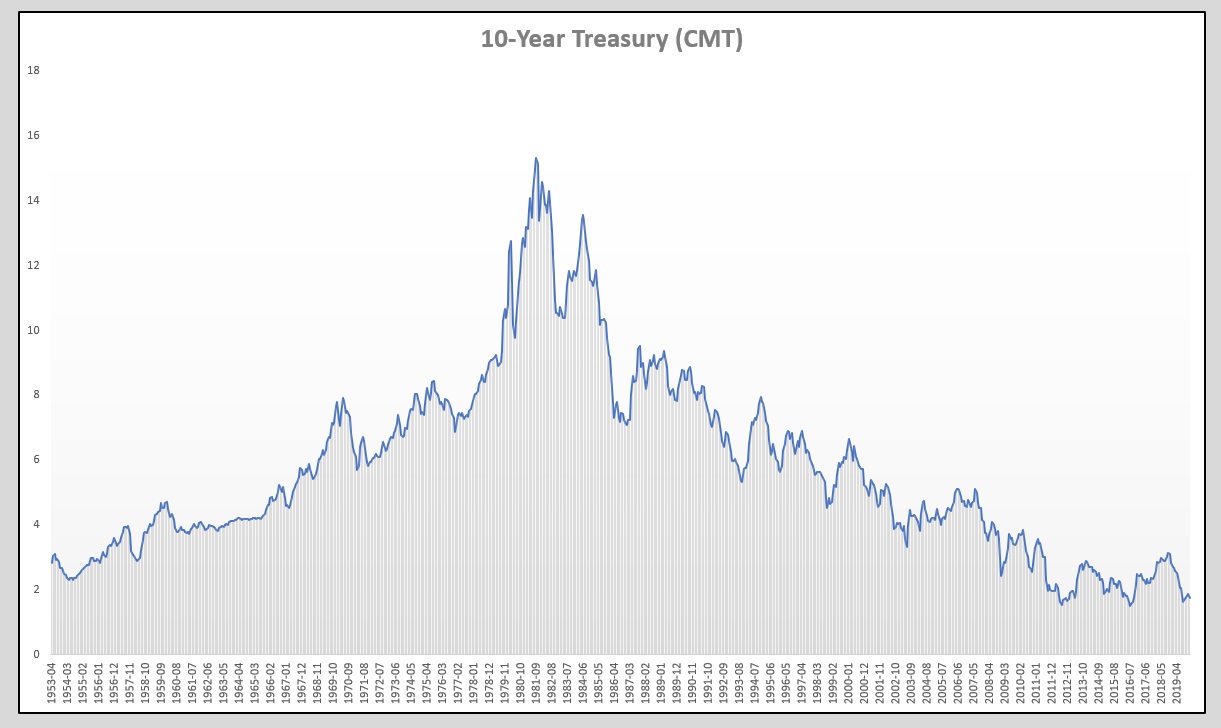
It’s worth noting the exceptionally high 10-year Treasury rates from around 1967 thru around 1997 — a 30 year period — are the aberration, not the rule. In September of 1981, the 10-year Treasury averaged 15.39%. Wow. Hard to believe, right? Especially as today’s rate of about 1.3% is only 1/10 of that rate.
Why were rates so high then? And why are they so low now?
The 10-year Treasury began 1977 at about 7%. It began 1997 at about 6.5%. So, if we simply remove this rate “mountain” from the chart, and consider it a one-time aberration, then we have a 10-year rate history that fluctuates between a high of about 7% and a low of, well, 1.3%.
The first question is easy to answer. Inflation. Or, more precisely, the inflation rate and inflation expectations. The second question is more difficult. But long-term readers of my blog know much of my logic around today’s low rates. A better question is where will the 10-year Treasury go from here?
For many reasons, I believe the inflation rate will remain at or below 2%. This is a longer discussion, but I’ve covered it many times in prior blogs. They are all here, on the SHI site, so feel free to peruse my historic writings. And I believe Bernanke was spot on, back in 2005, when he talked about the ‘global savings glut.’ Frankly it’s only grown larger since then. Here’s a link to his speech:
https://www.federalreserve.gov/boarddocs/speeches/2005/200503102/
I have to mention the coronavirus. The horrific human tragedy aside, all the markets are very worried about the impact this epidemic (or pandemic) will have on global business. Further, US investors are concerned this disease might push the US into a recession. For good reason. Global supply chains, and human behavior/choices, will most certainly be impacted. If the spread of the disease grows, airlines, theaters, restaurants, frankly any place people congregate, will be adversely impacted. Consumer spending, will be adversely impacted. This is what the markets are telling us.
As Treasuries are still perceived by investors around the world as the gold-standard, the coronavirus has increased bond demand, depressing yields about 10 or 15 basis points.
The bottom line?
Rates will probably hover around these low levels, and move up or down depending on both virus- and economic-developments. So, yes, you should probably look into refinancing your house. The process takes a while … so get started! We’ll talk more about rates as time passes. OK, off the the steakhouses!
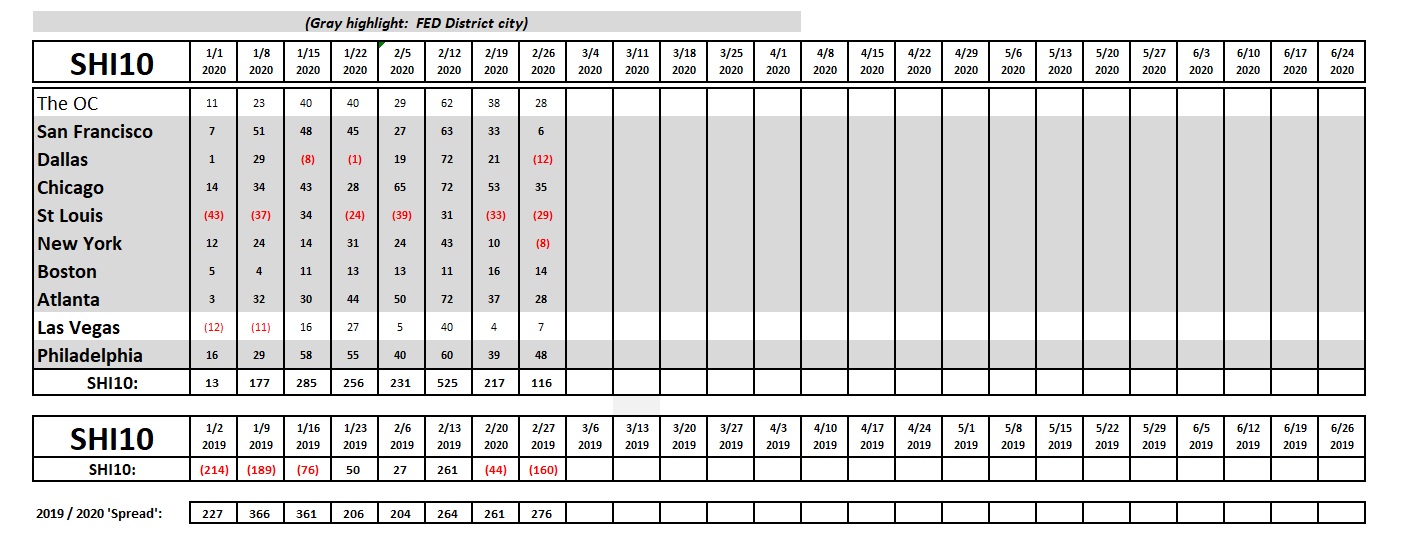
Reservation demand is down this week. Could this be a reaction to the coronavirus? I think not. As you’ll see below, this move is consistent with this week last year.
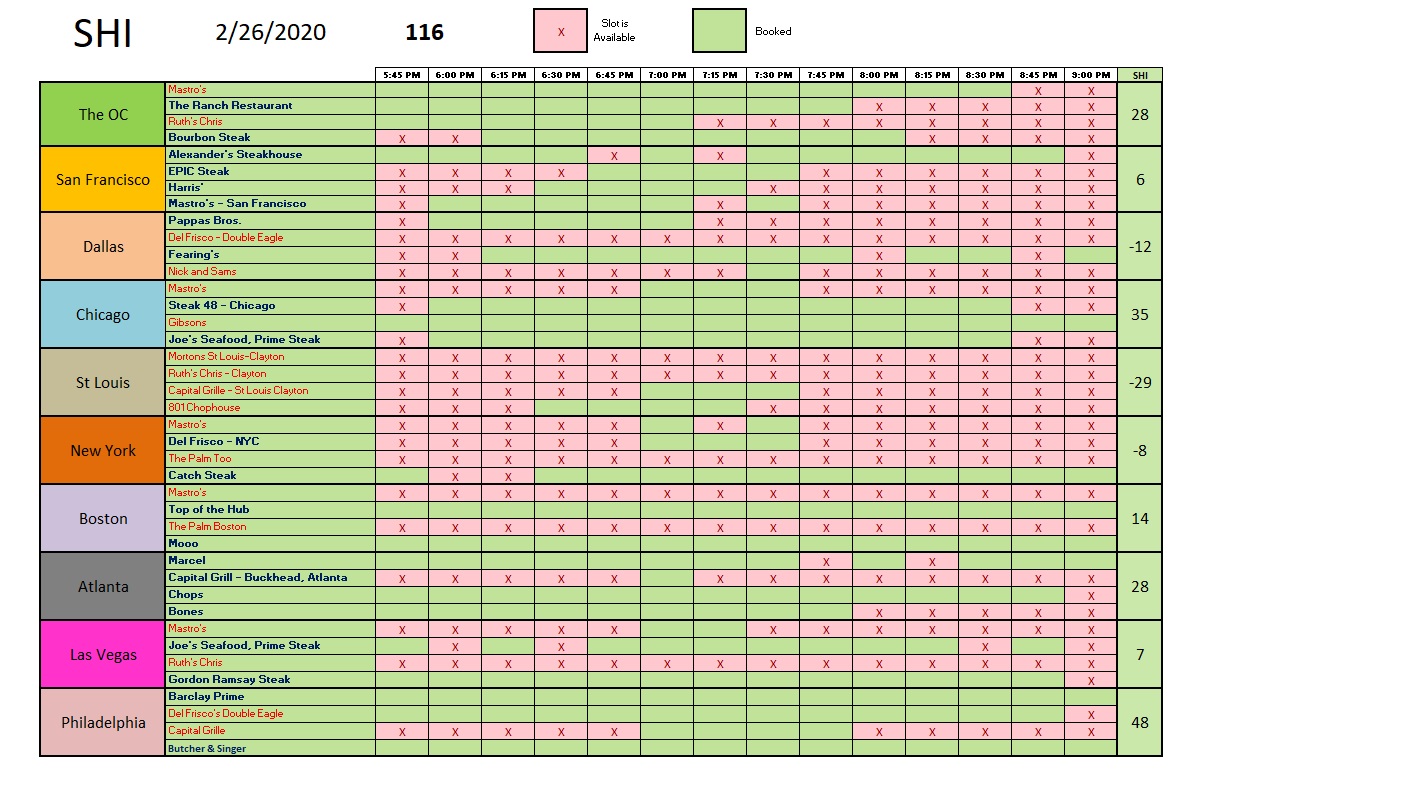
As you can see from the trend report below, the SHI10 moved from a <-44> to a <-160> during this week back in 2019. So the 100 or so point drop in this week’s SHI10 is consistent, as the ‘spread’ suggests below.
I’ve commented numerous times, in prior blogs, that US economic expansions don’t die of old age. Sure, sometimes we come close to “talking ourselves into a recession” with all the hand wringing suggesting this longest expansion in history has to end … it’s simply gone on too long! Not true. The FED remains acomodative, interest rates and inflation rates are under control and range-bound, and I haven’t seen market excesses, something Greenspan called ‘irrational exuberance,’ that often precede a recession. No, once the FED reduced short-term rates, as they needed, it lubricated the US and global economic machinery, helping grind the expansion forward.
No, recessions usually come from unexpected events. Like this one. So we’ll see. In the interim, get started on that refinance. But keep your closing costs very low. If mortgage rates go lower, you can refi again!
– Terry Liebman


