
SHI 12/6/17: Flirting with Inverting

SHI 11/29/17: Here’s The Problem
November 29, 2017
SHI 12/13/17: Another Look at GDP
December 13, 2017
I have to fess up: I copied my catchy BLOG title from an article in the Economist magazine.
I’m just not that creative. But the title is perfect. The Treasury yield curve today is very flat — closer to inverting. And we all know what happens when the yield curve inverts, right? Take another look at my blog from February of 2016: https://www.steakhouseindex.com/how-to-predict-a-recession-accurately/
Not only is the wordplay fun, but it succinctly captures the essence of today’s BLOG: Later this month, the FED will probably raise short-term rates another 25 basis points. After they do, the gap between the 3-month Treasury and the 10-year T will likely shrink once again — moving us even closer to an inverted condition.
Why do I say that? Well, take a look at this chart:
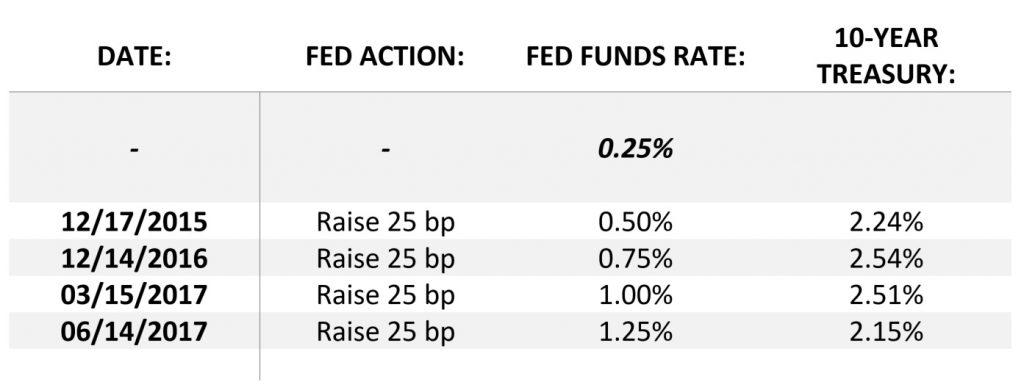
The FED has lifted short term rates by 1.00% — or 100 basis points — in the 2 years since December of 2015. And yet, the 10-year Treasury — a LONG-term rate — has remained completely range-bound. Today’s 10-year T rate is 2.3%, very close to the rate about 2 years ago when the FED began raising short-term rates.
So when they raise again on December 16th — and I believe they will — the ‘spread’ between short-term and long-term rates will likely shrink again. Probably moving us ever closer to an “inverted yield curve.” Should we be worried? Is a recession around the corner?
Welcome to this week’s Steak House Index update.
If you are new to my blog, or you need a refresher on the SHI, or its objective and methodology, I suggest you open and read the original BLOG: https://www.steakhouseindex.com/move-over-big-mac-index-here-comes-the-steak-house-index/
Why You Should Care: The US economy and US dollar are the bedrock of the world’s economy. This has been the case for decades … and will continue to be true for years to come.
Is the US economy expanding or contracting?
According to the IMF (the ‘International Monetary Fund’), the world’s annual GDP is almost $80 trillion today.
At last count, US ‘current dollar’ GDP is almost $19.5 trillion — about 25% of the global total. Other than China — a distant second at around $11 trillion — no other country is close.
The objective of the SHI and this blog is simple: To predict US GDP movement ahead of official economic releases — an important objective since BEA (the ‘Bureau of Economic Analysis’) gross domestic product data is outdated the day it’s released.
Historically, ‘personal consumption expenditures,’ or PCE, has been the largest component of US GDP growth — typically about 2/3 of the total. In fact, the majority of all US GDP increases (or declines) usually result from (increases or decreases in) consumer spending. This is clearly an important metric. The Steak House Index focuses right here … on the “consumer spending” metric.
I intend the SHI is to be predictive, anticipating where the economy is going – not where it’s been. Thereby giving us the ability to take action early.
Taking action: Keep up with this weekly BLOG update. Not only will we cover the SHI, but we’ll explore related items of economic importance.
If the SHI index moves appreciably -– either showing massive improvement or significant declines –- indicating growing economic strength or a potential recession, we’ll discuss possible actions at that time.
The BLOG:
Per the Economist article entitled “A flattening yield curve argues against higher interest rates” from November 30th: “The yield curve matters. It has inverted—ie, long-term rates have dipped below short-term ones—just before each of the past seven American recessions.”
The 3-month Treasury is about 1.3% today. If we add another 25 basis points, we’re at 1.55%. But with the 10-year Treasury in the 230s, while the curve isn’t very steep, the difference between the 10-year and the 3-month is still positive. Here’s the most recent chart from our friends at the St. Louis FED:

As of 12/1, the difference between the 10-year and the 3-months was 1.01% — still quite positive.
But shrinking. Does this mean we’re getting closer to a recession? Probably not. Remember, the FED is not trying to cause a recession. They raise rates for two reasons. First, they want to ‘normalize’ the level of short-term rates. By any measure, short-term rates have been exceptionally low for an exceptionally long time. Second, they want to keep the US economy on solid footing, preventing run-away growth and inflation. Think of the US economy as a car picking up speed … and the FED rate increases as speed bumps. The FED is laying down more speed bumps.
I don’t think they are overly concerned about the second challenge right now. I think ‘normalizing rates’ is their primary focus. But, FED motivation notwithstanding, if an inverted yield curve has preceded each of the prior 7 US recessions, we have to ask the question: Why is the FED raising short term rates if that action, by itself, may invert the yield curve?
The simple answer is the FED believes lifting the short-term rate will also push up long-term rates.
But, as we can see from the top chart, that relationship doesn’t appear to work. Why? The Economist suggests our financial markets believe a FED rate increase today will cause inflation to sag further tomorrow. And since long-term rates are highly correlated with the inflation rate, long-term rates will remain stagnant and remain range-bound — or lower. This is what the financial markets are telling us. They do not believe the inflation rate will increase any time soon. And each FED rate increase, the markets seem to believe, will push the inflation rate even lower.
Wells Fargo believes the yield curve may not invert this time. But their opinion — based on a unique analysis methodology — is the US economy will soon cross the recession threshold. In a research paper dated September 18, 2017 entitled “Is the Yield Curve Enough to predict Recessions,” they ended their report with this comment:
“We have proposed a new framework using the fed funds rate and the yield on the 10-year Treasury security to predict recessions. Our framework has predicted all recessions since 1955 with an average lead time of 17 months. Furthermore, we are forecasting one more rate hike in 2017 (December), and, in the case of a rate hike, the threshold will be met for this cycle.
Therefore, starting in December 2017, there is an increasing probability of a recession in the coming years. It is important to note that, at present, our official call is for continued moderate growth in 2018-2019 (around 2.5 percent GDP growth rate) and this framework suggests a downside risk our forecast.
Therefore, we are not making an official call for a recession over the two-year forecast horizon.
Instead, decision-makers may want to watch 2018 through mid-2019 for potential slowdown/recession. But, mindful of the analysis we have performed in this report, we will be watching incoming data closely to determine whether conditions that could lead to a recession/slowdown starting in late 2018 are developing.”
So, in Wells Fargo’s opinion, even though we’re close to the ‘recession’ edge, we will not fall over. At least not in 2018.
For you hearty economists out there, take a glance at their paper. It’s worth the effort: https://www08.wellsfargomedia.com/assets/pdf/commercial/insights/economics/special-reports/recession-prediction-short-20170918.pdf
Let’s take a look at our steakhouses and see if the holiday spirit has breathed a bit more life into Morton’s demand for Saturday dinners. Can ‘The Capital Grille’ finally boast that they, too, are popular? Let’s grab a steak knife and cut in.
Sorry, Capital Grill, but no. Yet again, you are the troll under the bridge from “Three Billy Goats Gruff.” Everyone wants to avoid you. 🙁
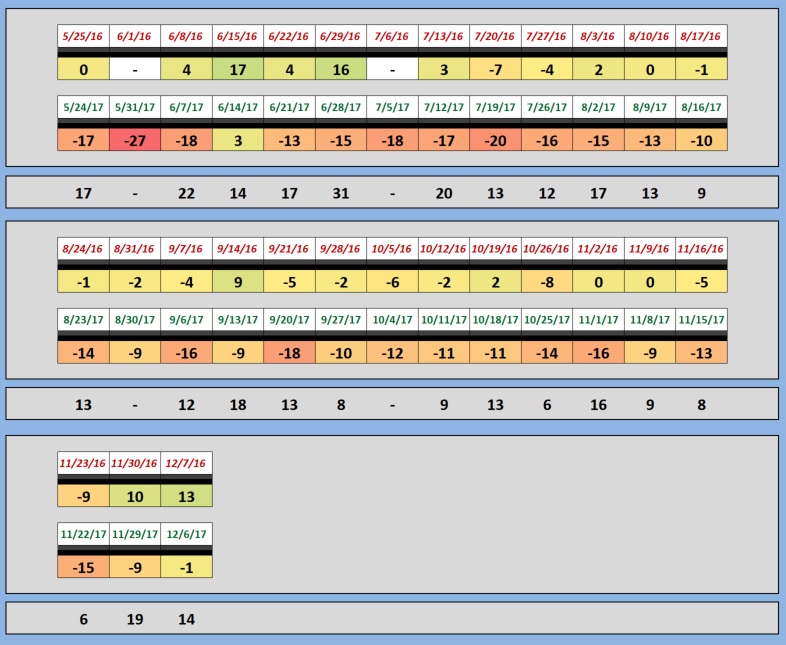
Mastros, on the other hand, and Ruths’ Chris to a lesser extent, are quite popular this week. The first available table at Mastros Ocean Club was 10 pm. Here are this weeks numbers … and the same week last year:

Looking at the longer-term trend, booked table numbers are a bit better, but not by much. The spread this week is high at 14 points. The SHI on December 7 of 2016 was a fairly robust ’13’ and it exploded from there: on 12/14 it was ‘21,’ on the 21st; the SHI peaked at ‘57;’ and, on the 28th, the SHI was ‘56.’ Seasonality absolutely impacted demand in 2016. It will be interesting to see if 2017 repeats the same pattern. Here is the longer term trend chart:
We have three take-aways today: First, get ready for another FED rate increase. In spite of tepid inflation readings, they will likely raise short-term rates again on 12/16.
Second, long-term are likely to once again ignore the increase and remain about where they were prior. Finally, while an inverted curve has accurately predicted the past 7 recessions, we’re not there yet. The 10-year / 3-month ‘spread’ is still positive. If ultra-low inflation is the cause of the next inverted rate curve, a recession may not be in the cards, regardless. Both the traditional methodology and Wells Fargo seem to agree. At least for 2018.
I apologize. In the last BLOG, I suggested I would dive deeper into the four GDP components this week. Let’s put that off a week.
Happy Holidays!
– Terry Liebman
