
SHI 11/1/17: Below the Radar

SHI: 10/25/14 Recession Talk
October 25, 2017SHI 11/8/17: Why Columbus Really Left Spain
November 8, 2017
OOPS! Missed that one!
The verdict is in: The SHI failed miserably to accurately predict third quarter, 2017, GDP growth. But the SHI had plenty of company: The New York Fed’s ‘Nowcast’ and the Atlanta Fed’s ‘GDPNow’ forecast also missed the mark. Why did all three models underestimate GDP growth? Private “investment” is the answer. Let’s explore further.
Welcome to this week’s Steak House Index update.
If you are new to my blog, or you need a refresher on the SHI, or its objective and methodology, I suggest you open and read the original BLOG: https://www.steakhouseindex.com/move-over-big-mac-index-here-comes-the-steak-house-index/
Why You Should Care: The US economy and US dollar are the bedrock of the world’s economy. This has been the case for decades … and will continue to be true for years to come.
Is the US economy expanding or contracting?
According to the IMF, the world’s annual GDP is almost $80 trillion today.
At last count, US ‘current dollar’ GDP is almost $19.5 trillion — about 25% of the global total. Other than China — a distant second at around $11 trillion — no other country is close.
The objective of the SHI is simple: To help us predict US GDP movement ahead of official economic releases — important since BEA data is outdated the day they release it.
‘Personal consumption expenditures,’ or PCE, is the single largest component of US GDP — is typically about 2/3 of the total. In fact, the majority of all US GDP increases (or declines) usually result from (increases or decreases in) consumer spending. Thus, this is clearly an important metric to track. The Steak House Index focuses right here … on the “consumer spending” metric.
I intend the SHI is to be predictive, anticipating where the economy is going – not where it’s been. Thereby giving us the ability to take action early.
Taking action: Keep up with this weekly BLOG update. Not only will we cover the SHI, but we’ll explore related items of economic importance.
If the SHI index moves appreciably -– either showing massive improvement or significant declines –- indicating growing economic strength or a potential recession, we’ll discuss possible actions at that time.
The BLOG:
Well, that didn’t work. The SHI forecast really missed the mark for Q3, 2017. I think I’m going to have to re-tool a bit. 🙂
I was expecting a relatively tepid reading — certainly below 2.0%. As you know by now, the first or “advanced” reading for GDP growth during the third quarter came in at a robust 3.0%. Of course this number can, and likely will, change as the second and final GDP readings are posted; but, by any measure, this is a surprisingly strong outcome. What was the cause?
Our GDP is the sum of four major business metrics:
- Personal consumption expenditures
- Gross private domestic investment
- Net exports of goods and services
- Government expenditures/investment
In the past, personal consumption expenditures — what we and the FED refer to as ‘PCE‘ — has contributed almost 70% of all GDP growth. The PCE measures all the ‘stuff’ we consumers purchase each quarter, as well as the services we pay for. Such as health care. So it stands to reason that the PCE is both the largest and the most consistent segment of GDP growth. PCE did, in fact, decline from Q2 and Q3, which is what the SHI expected. In Q2, PCE added 2.24% to the GDP. In Q3, 1.62%. (You may recall that in Q1, GDP growth was a measly 1.2% and the PCE added 1.32%: More than 100% of GDP growth resulted from PCE growth — meaning the other 3 segments actually reduced GDP during the quarter.)
On the other end of the spectrum from PCE is ‘government spending.’ Usually this category adds very little to GDP growth. In fact, in 7 of the past 15 calendar quarters, contribution from this sector was negative. As it was in this most recent quarter: Government spending reduced the final GDP figure by .02%.
Stuck right in the middle are the other two segments: ‘gross private domestic investment’ and ‘net exports.’
During Q3, 2017, net exports added the most to GDP growth since Q4 of 2013. Perhaps this should have been no surprise, as the dollar index — the measure of the value of our currency against a ‘basket’ of foreign currencies — declined meaningfully since July 1st:
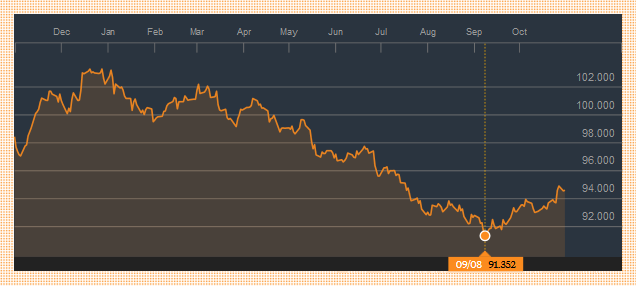
On 6/30, the dollar index was 95.6. By September 8, it had slipped to 91.3 — meaning US goods exported around the world became about 4.5% cheaper. And, at the same time, in the aggregate, US imports were more expensive by a similar amount. As the result of increase exports and decreased imports, the Q3 net exports figure should have made a strong showing. And it did. Contributing .41% to the 3.0% GDP growth figure during the quarter.
Using the ‘FRED’ tool provided by our good friends at the St. Louis Fed, I was able to create, then manipulate, the graphs for ‘Net Exports’ and a trade-weighted US Dollar Index, for the past 4 calendar quarters. Take a look:
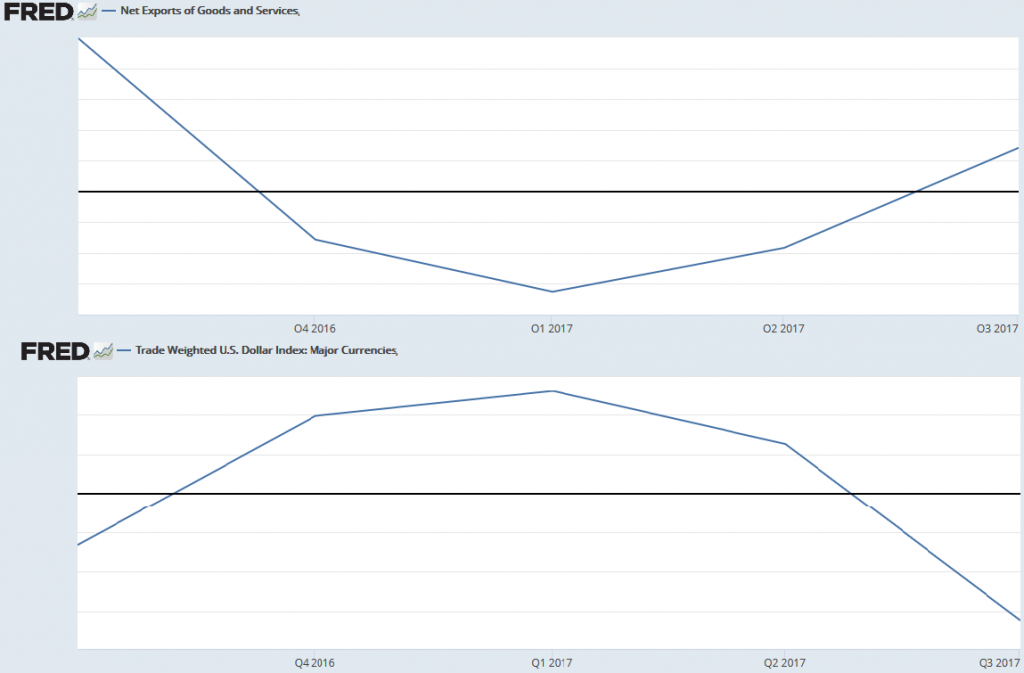
Sure enough, when the dollar index declines, net exports increase — and the opposite is true as well. Directionally, these two metrics appear to inversely correlate quite well. There may be some predictive value here, too.
The biggest surprise in the Q3 GDP number, in my opinion, was in the investment segment. During Q3, this segment contributed almost 1.0% of the 3% growth. Almost 1/3 of the total. “Non-residential fixed investment” in equipment added about 1/2 of the total. Or .47% of the total GDP gain. And this gain is right on the heels of a similar increase last quarter. Now that’s interesting.
How much money was invested in equipment last quarter? Let’s do the math. What is .47% of $19.495 trillion, then divided by 4? Go on, do it in your head. 🙂
Did you get about $22 billion for the last quarter? Then you are correct! In the past 2 quarters, US business have spent about $45 billion on new equipment. That is a sizable investment…and bodes well for potential future increases in labor productivity. We’ll talk about this more later.
What caused this sizable investment in equipment during Q2 and Q3? Timing may be part of it. The equipment sub-segment was extremely week in 2016. Perhaps it was time for a rebound.
But a more accurate explanation may be a growing perception by US businesses and their leaders that the time is ripe for business expansion. While the current administration hasn’t yet experienced much success passing large, sweeping regulation, they have made a significant dent in one area: deregulation. The administration is rapidly trimming red tape.
Like it or not, according the the US Chamber of Commerce, this administration has been very effective at eliminating regulations:
- 29 executive actions — executive orders by the administration — to reduce regulatory requirements have been issued.
- Executive-branch agencies have, as a result, issued 100 directives intended to either eliminate or shrink current regulations.
The chamber lists another 50 or so pieces of regulation-cutting legislation introduced to Congress since January 20. Behind the scenes, they have been busy. And quite possibly, business investment has responded in kind.
In spite of the fact that the predictive power of the SHI proved more gristle than USDA Grade A beef during Q3, I continue to believe it has value as a predictive tool. I think we’ll need to do a bit of re-tooling, but I feel the fundamentals are there. So while I consider possible improvements — one of which is to increase the number of test markets to 10 or 15 — let’s return to our local eateries and see how they’re doing this week:
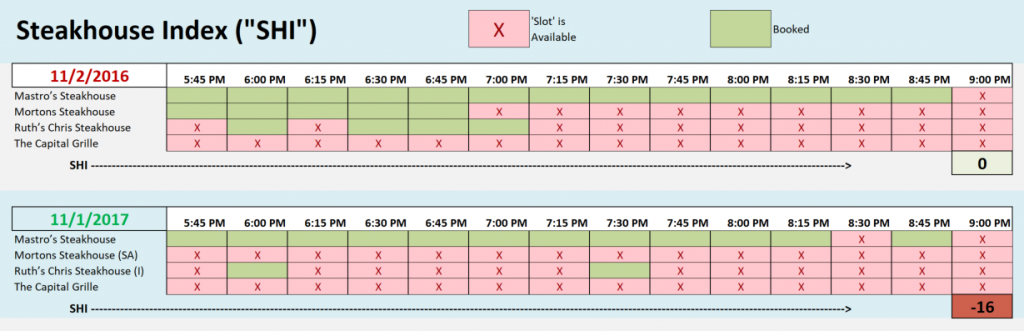
Well, this is interesting! On November 4th, if you’re interested, you can be enjoying Lobster Mashed Potatoes at Mastros Ocean Club! At either 8:30 or 9:00 pm. This hasn’t happened in many weeks. But, once again, the fact that Mastros has openings suggests weaker consumer demand. And the spread between this week’s SHI number and the SHI one year ago has increased to one of the highest levels in months:
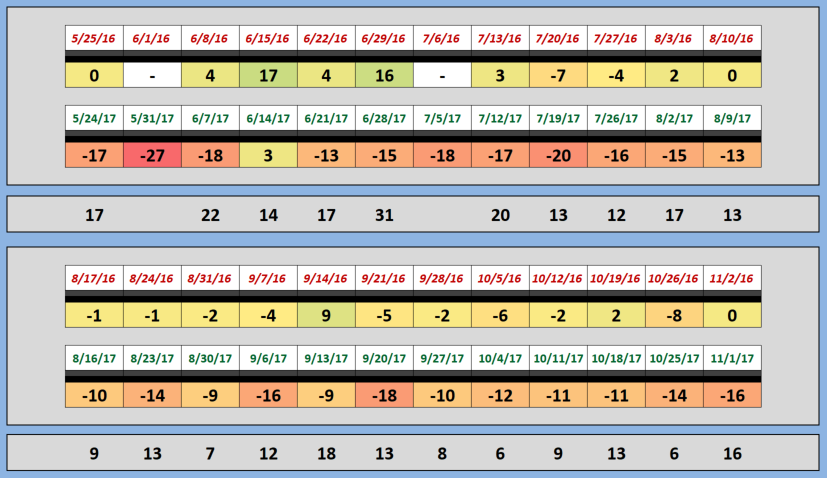
Is this meaningful? I believe it is. And while the SHI was unable to accurately predict the Q3 GDP growth number, it did accurately forecast a slowing in consumer spending. Remember: During Q2, PCE added 2.24% to GDP growth (on an annualized rate). In Q3, it added only 1.62% — a decline of almost 28%.
So maybe the SHI did it’s job — somewhat? 🙂
Capital spending is a long-run contributor to GDP growth. Over the long-run, new plant & equipment can lead to productivity increases by providing labor with resources to increase output within the same amount (unit) of time. If businesses, collectively, feel the climate for investment is ripe (they appear to), and this trend continues, we may very well see a meaningful long-run GDP increase.
Because equipment capital spending gives workers more and better resources to work with. Resources which may, over time, increase labor productivity. And if productivity growth improves, it is likely we will see a corresponding improvement in GDP growth.
- Terry Liebman


