
SHI 11/29/17: Here’s The Problem
SHI 11/22/17: The FED is Santa Claus!
November 22, 2017
SHI 12/6/17: Flirting with Inverting
December 6, 2017
Unfortunately, doubling the size of the FED’s balance sheet — as I “tongue-in-cheek” suggested last week — is a bad idea.
Which is unfortunate, because the financial benefit to the Treasury is quite significant. Our national debt is about 1/2 a trillion dollars smaller than it otherwise would have been without the FEDs massive gift. In fact, doubling the size of the FEDs balance sheet would pay for the tax cut pending in Congress! But, still, it’s a bad idea.
By the way, I’ve had a few questions about the mechanics behind the FEDs $4.5 trillion mountain of assets. “How did the FED acquire these assets?” some have asked. It’s pretty simple. On a typical balance sheet, every asset requires a corresponding liability. In this case, the FED simply increased the amount of US currency in circulation (a liability to the FED) and used this currency to buy US Treasury Bonds and ‘mortgage backed securities’ (the assets.) The liability costs the FED very little each year; the asset, on the other hand, generates a return equal to its note rate.
But as nice as this gift is, much like a great meal at Mastros, it comes with a large bill, payable some time in the future. Let me explain.
Welcome to this week’s Steak House Index update.
If you are new to my blog, or you need a refresher on the SHI, or its objective and methodology, I suggest you open and read the original BLOG: https://www.steakhouseindex.com/move-over-big-mac-index-here-comes-the-steak-house-index/
Why You Should Care: The US economy and US dollar are the bedrock of the world’s economy. This has been the case for decades … and will continue to be true for years to come.
Is the US economy expanding or contracting?
According to the IMF (the ‘International Monetary Fund’), the world’s annual GDP is almost $80 trillion today.
At last count, US ‘current dollar’ GDP is almost $19.5 trillion — about 25% of the global total. Other than China — a distant second at around $11 trillion — no other country is close.
The objective of the SHI is simple: To help us predict US GDP movement ahead of official economic releases — important since BEA data is outdated the day they release it.
‘Personal consumption expenditures,’ or PCE, is the single largest component of US GDP — is typically about 2/3 of the total. In fact, the majority of all US GDP increases (or declines) usually result from (increases or decreases in) consumer spending. Thus, this is clearly an important metric to track. The Steak House Index focuses right here … on the “consumer spending” metric.
I intend the SHI is to be predictive, anticipating where the economy is going – not where it’s been. Thereby giving us the ability to take action early.
Taking action: Keep up with this weekly BLOG update. Not only will we cover the SHI, but we’ll explore related items of economic importance.
If the SHI index moves appreciably -– either showing massive improvement or significant declines –- indicating growing economic strength or a potential recession, we’ll discuss possible actions at that time.
The BLOG:
Take a look at this image:

First, note I’ve added the blue and black lines. I’ll discuss the reason below.
I’ve sourced this image from a fabulous paper written by Claudio Borio, the Head of the BIS Monetary and Economic Department. You’ll recall the ‘BIS‘ is the Bank for International Settlements — the giant “central bank of all central banks” I first wrote about back in July (https://www.steakhouseindex.com/shi-update-71217-the-silent-giant/) when I called them “The Silent Giant.” Take a look.
Borio’s paper was more focused on inflation than the issue I raise above. Which is why I strongly recommend you read his entire paper. It is well worth the effort. Here’s the URL:
https://www.bis.org/speeches/sp170922.pdf
For decades, conventional wisdom among economists held an inverse relationship exists between the unemployment rate and the inflation rate. Borio, once again, dispels this myth. Borio, too, believes globalization has rendered the relationship almost meaningless. He feels the globalization of “product, capital and labor markets” have all played a significant role in keeping inflation low – even as economies around the world are all experiencing synchronized growth. His comment:
“Is it reasonable to believe that the inflation process should have remained immune to the entry into the global economy of the former Soviet bloc and China and to the opening-up of other emerging market economies? This added something like 1.6 billion people to the effective labor force, drastically shrinking the share of advanced economies, and cut that share by about half by 2015.”
Well said. OK, back to the image above.
Interest rates have been declining globally since the early 1980s. The blue line shows the trajectory. Rate is shown on the left hand side of the graph. On the right hand side is shown GDP for of the major economies, including China. The blue mountain shows the growth in global debt each year since 1986 — as a percentage of global GDP.
It’s easy to see the mountain of global debt — as a % of GDP — has increased rapidly since about 2008. And here’s the point: Beginning in 2008, the trajectory for interest rates declined even steeper. See the black line. As a result, long term interest rates are likely about 150 basis points lower than the rate indicated by the general trend — again, the blue line. Why? What happened in 2008?

As we see above, “quantitative easing” on a global scale. Central banks around the globe worked in harmony to furiously inject currency into their economies to combat the horrible effects of the Great Recession.
In 2008, the 3 central banks shown above had assets of about $4 trillion. Today that figure is closer to $14 trillion. Like the FED, each of the central banks increased their assets by increasing the amount of their respective currency in circulation. That additional $10 trillion of dollars, euro and yen is now sloshing around in the global financial markets.
This coordinated central bank move pushed long term interest rates down quickly … which in turn inspired folks to borrow quite a bit of money. And therein lies the problem: Cheap debt seems to have lured companies and individuals around the world to borrow tons of money — probably more than they would have had rates been higher. According to the Institute of International Finance (IIF), global debt has climbed at an “eye-watering” pace over the past decade. Per the IIF, total global debt levels — including household, government and corporate debt — has climbed by more than $70 trillion over the last 10 years to a record high of $215 trillion.
Which, in some respects, handcuffs the central banks. To quote Mr. Borio, it is much “harder to raise interest rates without causing economic damage owing the the large debts…” accumulated over the past decade. I completely agree.
And this is the reason, frankly, why the FED now plans to slowly … VERY slowly … shrink their asset base. A fast move would destabilize the financial markets. For the same reason, it would be imprudent to increase the size of the FEDs balance sheet any further. Which is truly unfortunately. Because an extra $100 billion a year is awfully nice.
The second problem is the rate itself. If we assume the central bank actions have lowered long-term rates below their ‘natural’ rate, unwinding these positions may have the impact of pushing rates back up. A very slow unwinding may help keep a lid on rate moves. For now, only one central bank — the FED — is actively shrinking their balance sheet. However, the ECB is talking about doing the same sometime in 2018.
Shall we take a look at our steakhouses? Once again, Mastros is fully booked this coming Saturday. And while reservation activity at Ruths’ Chris is fairly robust, both ‘The Capital Grill’ and Mortons remain comatose. Like a raw steak on a plate. Not one time slot is booked at either eatery. Ouch.
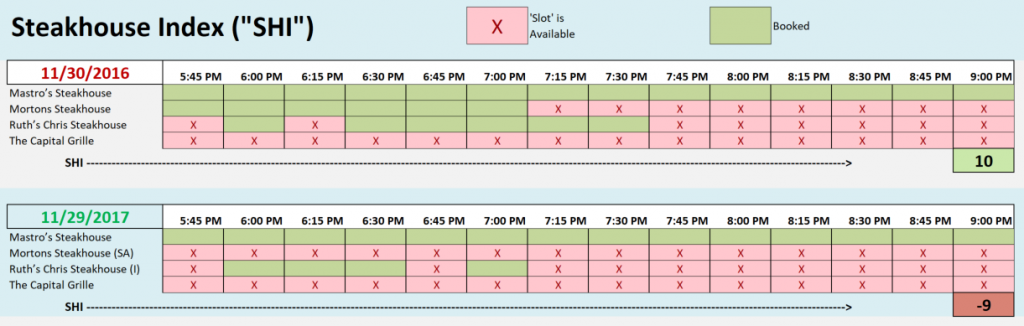
You can see the SHI reading a year ago was a positive 10, and this week, we’re at a negative 9. This is the largest ‘spread’ we’ve seen in months. Take a look:

But we have to ask ourselves if it’s meaningful or indicative.
We saw similar weakness in Q2 of this year. This morning the BEA (Bureau of Economic Analysis) released their ‘second estimate’ of Q2 GDP. The BEA increased the number slightly to 3.3% for Q3. You may recall my forecast based on SHI metrics was sub-2%. So far this quarter, the SHI is suggesting similar weakness in consumer spending…and is suggesting Q4 GDP growth will be muted. This forecast remains in conflict with the various ‘nowcast’ reports I follow.
Next week, we’ll dig into the 4 individual GDP components and see if we can glean anything further. But for now, I’m not putting much stock in the predictive power of the SHI.
– Terry Liebman


