SHI 1/15/2020 – The Roaring 20s Are Here Again. Not.

SHI 1/8/2020 – The Future is Looking Smaller.
January 8, 2020
SHI 1.22.20 – When a House is a Bad Investment
January 22, 2020
“I really enjoy economic forecasts.”
Some of them are SOOOOOOOooooo entertaining. Who doesn’t love good fiction, right? For example, take a look at this one (right click, ‘open link in new tab’) :
https://blog.itreconomics.com/blog/new-roaring-twenties
Per the author, not only is the 2nd “Great Depression” definitively arriving at the end of this decade, but – GOOD NEWS! – the author assures us this decade will be a repeat of the economic and financial successes of the ‘Roaring ‘20s’! Fabulous! That’s great news!
Sorry, Lauren, but while your forecast is a certainly fun to read, I’m afraid it lacks credibility. Why? Facts. It doesn’t have any. I’m guess I’m just old-fashioned: I like my economic forecasts to be fact-based. Yep, I’m a fuddy duddy. 🙂
Welcome to this week’s Steak House Index update.
If you are new to my blog, or you need a refresher on the SHI10, or its objective and methodology, I suggest you open and read the original BLOG: https://www.steakhouseindex.com/move-over-big-mac-index-here-comes-the-steak-house-index/
Why You Should Care: The US economy and US dollar are the bedrock of the world’s economy. This has been the case for decades … and will be true for years to come.
But is the US economy expanding or contracting?
According to the IMF (the ‘International Monetary Fund’), the world’s annual GDP is about $85 trillion today. According to the most recent estimate, US ‘current dollar’ GDP now exceeds $21.53 trillion. In Q3 of 2019, nominal GDP grew by 3.5%, following a 4.7% annualized growth rate in Q2. The US still produces about 25% of global GDP. Other than China — in a distant ‘second place’ at around $13 trillion — the GDP of no other country is close. The GDP output of the 28 countries of the European Union collectively approximates US GDP. So, together, the U.S., the EU and China generate about 70% of the global economic output.
The objective of this blog is singular.
It attempts to predict the direction of our GDP ahead of official economic releases. Historically, ‘personal consumption expenditures,’ or PCE, has been the largest component of US GDP growth — typically about 2/3 of all GDP growth. In fact, the majority of all GDP increases (or declines) usually results from (increases or decreases in) consumer spending. Consumer spending is clearly a critical financial metric. In all likelihood, the most important financial metric. The Steak House Index focuses right here … on the “consumer spending” metric. I intend the SHI10 is to be predictive, anticipating where the economy is going – not where it’s been.
Taking action: Keep up with this weekly BLOG update. Not only will we cover the SHI and SHI10, but we’ll explore related items of economic importance.
If the SHI10 index moves appreciably -– either showing massive improvement or significant declines –- indicating growing economic strength or a potential recession, we’ll discuss possible actions at that time.
The BLOG:
Could this decade be a repeat of The Roaring ‘20s? It’s doubtful. Consider the data – something missing from the above forecast – from the years 1920 to 1929:
- ‘Real’ GNP (GDPs predecessor) grew by an average of 4.2% per year (Gene Smiley, EH.net)
- US population grew from 106 million in 1920 to 123 million in 1930 – a 16% increase. (US Census Bureau) An impressive feat given the immigration decline.
- The labor force grew faster than the population. (Gene Smiley, EH.net)
- All the while, worker earnings growth was low. The ‘weekly’ earnings for a skilled manufacturing worker, in 1920, was $29.16. In 1929 – the peak year – this had increased to $32.60 – only an 11.8% increase over 10 years. (US Dept of Commerce.)
Against this factual backdrop, Gene Smiley commented: “Economic growth in the 1920s was impressive. Ownership of cars, new household appliances, and housing was spread widely through the population. New products and processes of producing those products drove this growth. The combination of the widening use of electricity in production and the growing adoption of the moving assembly line in manufacturing combined to bring on a continuing rise in the productivity of labor and capital. Though the average workweek in most manufacturing remained essentially constant throughout the 1920s, in a few industries, such as railroads and coal production, it declined. (Whaples 2001) New products and services created new markets such as the markets for radios, electric iceboxes, electric irons, fans, electric lighting, vacuum cleaners, and other laborsaving household appliances. This electricity was distributed by the growing electric utilities. The stocks of those companies helped create the stock market boom of the late twenties. RCA, one of the glamour stocks of the era, paid no dividends but its value appreciated because of expectations for the new company. Like the Internet boom of the late 1990s, the electricity boom of the 1920s fed a rapid expansion in the stock market.”
During this period, US industrial growth was impressive. We were a manufacturing powerhouse. Not today. Today, conditions are dramatically different. In fact, nearly all manufacturing growth in the past 20 years has been from non-durable goods manufacturing. These are products with a short life, products quickly consumed, like food, paper, and petroleum.
Unlike 100 years ago, in 2018 manufacturing accounted for only 6.7% of all jobs. Only 13.5 million people were employed full- or part-time in American manufacturing, according to data from the Bureau of Economic Analysis. Last year, the manufacturing industry, as a whole, accounted for just $2.3 trillion of GDP, about 11%.
As the 2020s begin, our annual GDP growth is probably less than one half that of the Roaring 20s. As I reported in last week’s blog, population growth in the past 10 years was a paltry 7.1%, again less than ½ of the 1920s – and this decade’s population growth will likely be lower still, if even positive. Yes, it is very likely the US population – over all – will shrink this decade.
Next, we have the labor force growth challenges. According to the US Bureau of Labor Statistics, the ‘civilian labor force’ totaled about 162 million folks at the end of 2018. They forecast it will reach just under 171 million by the end of 2028, an increase of about 5.5%. Said another way, that’s an increase of only about ½ a percent per year.
https://www.bls.gov/emp/tables/civilian-labor-force-summary.htm
Finally, we have the huge issue of aging US population. According to the Census Bureau, by 2030 every Baby Boomer will be 65 or older. Hey Boomer, check this out!
Which means by 2030, 1 of every 5 US citizens will be at or beyond ‘retirement age.’ As 2/3 of our economy is consumption based and driven, we have to consider what retired folks buy … and the fact that they spend less money overall. According to the US News magazine, “Retirees generally spend less money than people who are working. The average retired household has about 22% lower costs than the average working household and spends about $14,000 less per year, according to U.S. Bureau of Labor Statistics data.”
Roaring 20s? Not a chance. So, now that I’ve shared my thoughts and opinions, thoroughly trashing her forecast, let me say this: She could be right. The 1920 was a decade at the forefront of modern times. Man and business learned to harnessed the power of electricity, the “new” technology of the time. Science and physics became tangible, and new products, businesses and industries seemed to pop up overnight leveraging these new discoveries.
Interestingly, today we find ourselves at a somewhat similar spot: Artificial intelligence and the IoT are at today’s forefront. Industry has gone digital. And we are seeing traditional Newtonian physics give way to the budding world of quantum mechanics – whatever that really means. Could AI, IoT and quantum theory usher in a 2020s reminiscent of the 1920? Sure. It’s certainly possible. I have no doubt great new discoveries and new applications are on the horizon, but I have serious doubts about how well or how much these changes will drive the overall economy. Let me explain.
Unlike the 1920s, today’s developed world has serious resource limitations. I believe that in the 2020s and beyond, these limitations create demand headwinds. Declining growth in the working age population, the significant increase in aged population, static productivity, and close-to zero range-bound interest rates across the globe all create a very difficult landscape for the kind of demand growth needed to propel our economy to the levels resembling the 1920s. Unfortunately, these are the facts. I’ve talked about these limits extensively in past blogs. I feel financial growth and business expansion are definitely possible, but instead of the widespread “a-rising-tide-lifts-all-boats” type of growth the US experienced in the past 50 or so years, I believe demand constraints will make growth opportunities harder to spot, and success will come to those able to surgically apply intelligence and know-how. Rest assured, people and companies will succeed, but future results will be uneven. Further, I believe this future is already here. Now. And so, for this reason, I sincerely doubt the 2020s will be a carbon copy of, or even anything closely resembling, the 1920s. Of course, I could be completely wrong – predictions often are. And we all know how much old people love to complain about how things aren’t like the use to be! People like me. ?
But I feel I’m more right than wrong. Unfortunately. When the 4 most valuable technology companies in the world – Apple, Microsoft, Alphabet and Amazon – have a combined market capitalized value of about $5 trillion, I have trouble considering these companies to be ‘growth’ companies, on the edge, ready to take off. I think rapid growth for these companies is in the rear-view mirror. They have already boomed. A new and innovative technology — electricity — propelled business and stock market growth to lofty heights during the 1920s. I don’t see that happening this decade. In fact, I’m worried corporate earnings will not be sufficient to keep the market where it is today. I’ll talk more about this in the next blog. But for now, you know where we’re going: The Steak Houses!
Everyone else is going here too. Check out this week’s numbers:
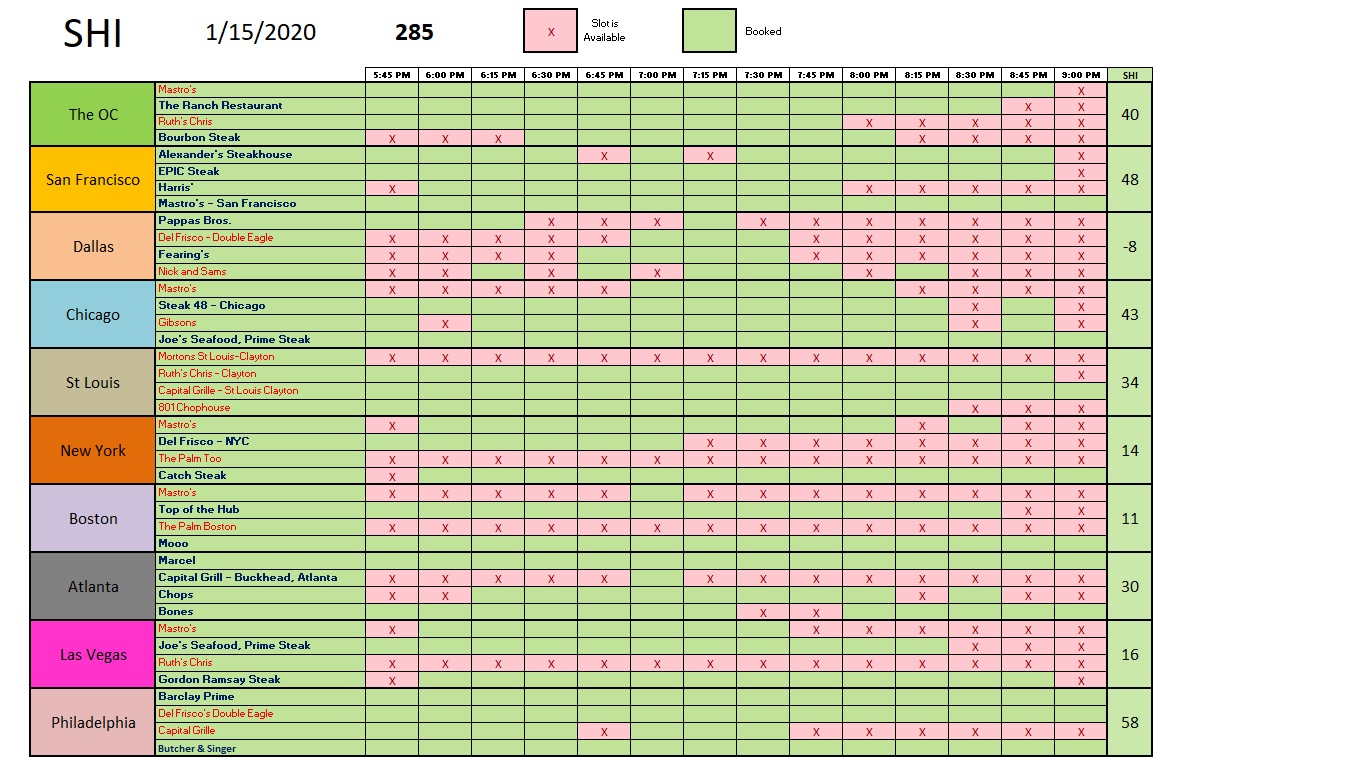
I’m seeing an awful lot of green — reservation demand that translates into “green” for the expensive steakhouse owners. Repeating once again, the data set is different than that of 2019 (new restaurants appear in blue above), but WOW! check out this weeks SHI10. This is an impressive reading. Here is the longer term trend report:
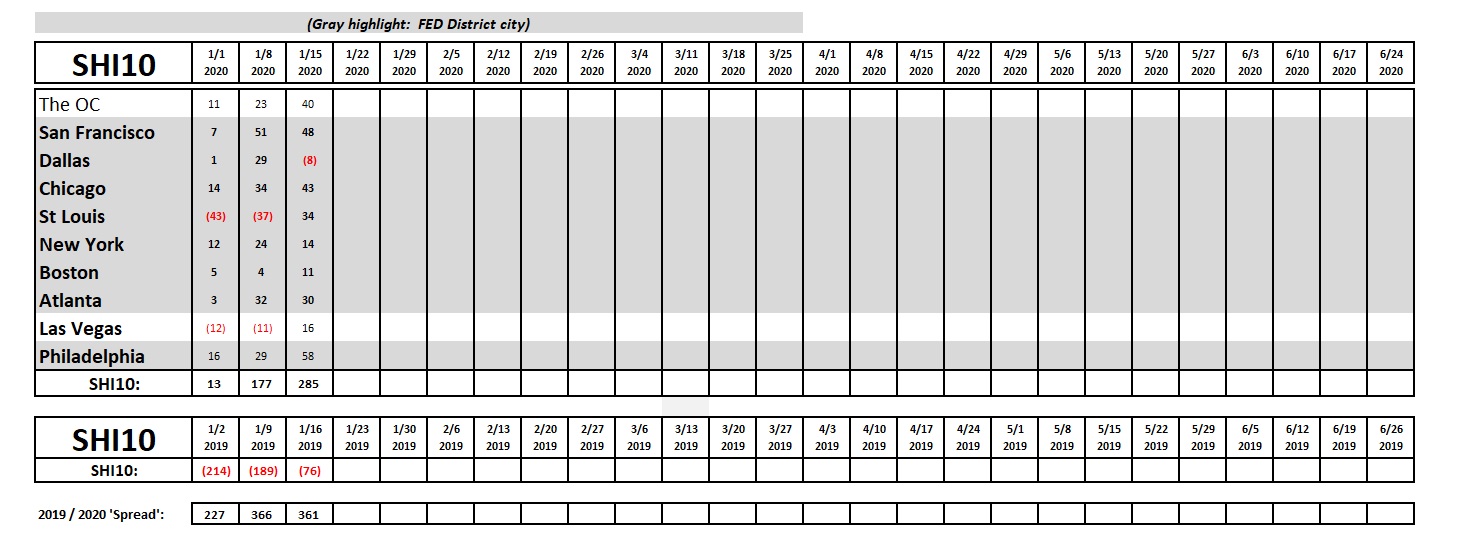
As shown above, this week’s SHI10 is more than 100 points higher than last week. Keeping it all in context, however, this week last year saw a similar jump in reservation demand…so the ‘spread’ remains somewhat consistent. St Louis must have thawed-out this week — all of a sudden, everyone in St Louis is hankering for a pricey slab of beef. Check out the improvement here.
All in all, the SHI is suggesting the economy is still cookin’.
Earlier today, the FED released the Beige Book. This report is produced every 6 weeks. Remember, economic conditions in the cities highlighted in gray above contribute to the Beige Book data set. Take a look:
https://www.federalreserve.gov/monetarypolicy/files/BeigeBook_20200115.pdf
Here’s the summary:
“Economic activity generally continued to expand modestly in the final six weeks of 2019. The Dallas and Richmond Districts noted above-average growth, while Philadelphia, St. Louis, and Kansas City reported sub-par growth. Consumer spending grew at a modest to moderate pace, with a number of Districts noting some pickup from the prior reporting period. On balance, holiday sales were said to be solid, with several Districts noting the growing importance of online shopping. Vehicle sales generally expanded moderately, though a handful of Districts reported flat sales. Tourism was mixed, with growth reported in the eastern seaboard Districts but activity little changed in the Midwest and West. Manufacturing activity was essentially flat in most Districts, as in the previous report. Business in nonfinancial services was mixed but, on balance, growing modestly. Transportation activity was also mixed across Districts, with a majority reporting flat to weaker activity. Banks mostly characterized loan volume as steady to expanding moderately. Home sales trends varied widely across Districts but were flat overall, while residential rental markets strengthened. Some Districts pointed to low inventories as restraining home sales. New residential construction expanded modestly. Commercial real estate activity varied substantially across Districts.”
I agree: Our economy continues to grow modestly. Good. Enjoy your steak!
– Terry Liebman