SHI 08.01.18 Is Our Expansion DOA?
I Have No Beef Here!
July 27, 2018
SHI 08.08.18 Affording In the Middle of Nowhere
August 8, 2018
“The reports of my death are greatly exaggerated …”
… said humorist Mark Twain, when traveling in London in 1897. Believing he had died, a US newspaper mistakenly printed his obituary. Oops. The error was understandable: 120 years ago, news traveled the world very slowly. Accuracy, as a result, was sometimes questionable.
Today, of course, information transverses the globe in nanoseconds. As a result, data precision and accuracy have never been better … but our conclusions are not. Take the “inverted yield” curve debate as an example. Our data set is excellent and complete; economists’ conclusions, however, are as muddy and opaque as Mark Twain’s beloved Mississippi River.
Welcome to this week’s Steak House Index update.
If you are new to my blog, or you need a refresher on the SHI10, or its objective and methodology, I suggest you open and read the original BLOG: https://www.steakhouseindex.com/move-over-big-mac-index-here-comes-the-steak-house-index/
Why You Should Care: The US economy and US dollar are the bedrock of the world’s economy. This has been the case for decades … and will continue to be true for years to come.
Is the US economy expanding or contracting?
According to the IMF (the ‘International Monetary Fund’), the world’s annual GDP is about $80 trillion today. US ‘current dollar’ GDP now exceeds $20.4 trillion. In Q2 of 2018, We remain about 25% of global GDP. Other than China — a distant second at around $11 trillion — the GDP of no other country is close.
The objective of the SHI10 and this blog is simple: To predict US GDP movement ahead of official economic releases — an important objective since BEA (the ‘Bureau of Economic Analysis’) gross domestic product data is outdated the day it’s released. Historically, ‘personal consumption expenditures,’ or PCE, has been the largest component of US GDP growth — typically about 2/3 of all GDP growth. In fact, the majority of all GDP increases (or declines) usually results from (increases or decreases in) consumer spending. Consumer spending is clearly a critical financial metric. In all likelihood, the most important financial metric. The Steak House Index focuses right here … on the “consumer spending” metric. I intend the SHI10 is to be predictive, anticipating where the economy is going – not where it’s been.
Taking action: Keep up with this weekly BLOG update. Not only will we cover the SHI and SHI10, but we’ll explore related items of economic importance.
If the SHI10 index moves appreciably -– either showing massive improvement or significant declines –- indicating growing economic strength or a potential recession, we’ll discuss possible actions at that time.
The BLOG:
Just weeks ago I reported how the Atlanta FED President has become increasingly concerned about this harbinger of recession. He is not alone. Many well known economists are very concerned about the flattening, or inverting, yield curve. Here are a few meaningful snap-shots from our friends at the St. Louis FED:
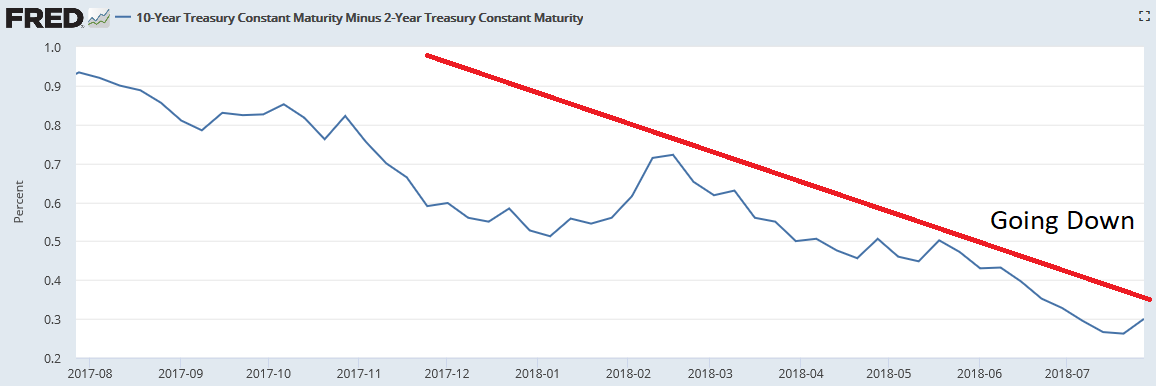
This is the “10 minus 2” chart for the prior 12 months. The 10-year Treasury yield minus the yield on the 2-year Treasury. Going down? Yep. I’ve added the red line for emphasis…but the trajectory of the blue line — the data line — is pretty clear. Down, down, down. Today, the 10-year T is only 30 basis points higher than the 2 year.
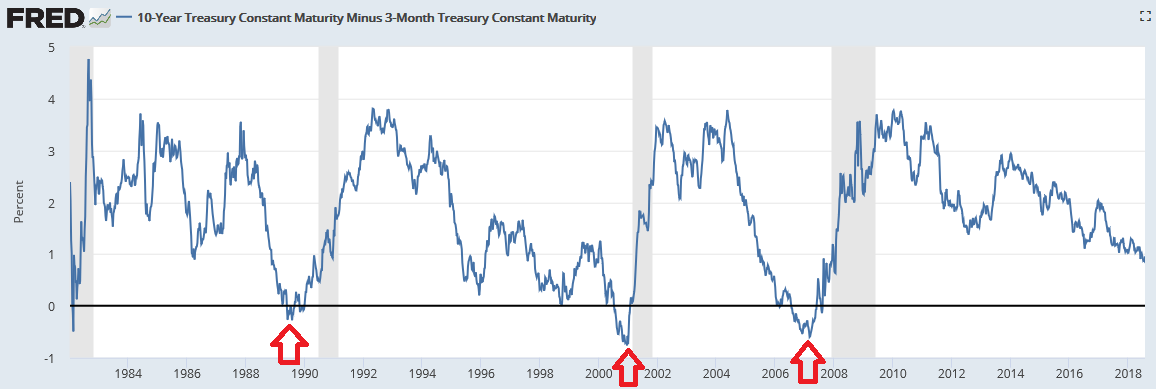
And here is the 10-year T minus the 3-month Treasury yield. This chart goes back to 1984 … and shows three recessions (in gray) that followed curve inversion. Remember, inversion happens when short term rates (3-month Treasury) are higher than long term rates. Conventional wisdom — and this chart — suggest a recession is not far behind a sustained curve inversion. And while this spread, too, is going down, down, down … we can take some solace in the fact that the July 27th spread was still a healthy 96 basis points. No inversion. Yet.
Adding more fuel to the fire, since America is not an island, we need to consider how the economies of our trading partners are holding up. Bad news: the economies in both Asia and Europe seem to be slowing. Chinese manufacturing and housing are weak; the Bank of Japan decided to keep their almost zero rates at zero, and further commented they would keep interest rates low for an “extended period of time.”
Further, Eurostat (the European Union statistical information source) reported the ‘advanced’ Q2 GDP reading for the euro area at 2.1% — down from 2.5% in the first quarter. Even worse, EU core inflation came in at a paltry 1.1%.
Economically speaking, things are not looking good across either of the ‘ponds.’
In the opposite corner, we have Friday’s GDP figures. Hotter than Ruths’ Chris grill, our Q2 GDP growth figures were stunning. Perhaps not to the Atlanta FED forecasters, but certainly to me. Yes, this is the first ‘advance‘ reading, subject to revisions, but a 4.1% annualized ‘real’ GDP growth figure is impressive even if later revised. And the ‘nominal’ 7.4% growth rate is absolutely staggering. This is a huge increase. Diving deeper into the Bureau of Economic Analysis (BEA) detailed numbers, it’s easy to conclude our US economy is firing on all cylinders.
So, which is it? Is our economy roaring like a lion … or are we just a dozen or so months or so away from our next recession? Is our almost 10-year-old expansion DOA?
Nope. No more than Mark Twain died in 1897.
Rest assured, there are plenty of threats out there: Curve inversion, struggles in China, weakness in Japan and the EU, greater tariffs and for a longer duration, possible wage pressures, a slowdown in new- and existing-housing sales, the one-time boost from the tax cuts and repatriation, etc. There are plenty of reasons to be mildly morose. But we’ll leave these for later. For now, consider this. During Q2, 2018 our economy made these gains:
- ‘Personal Consumption Expenditures’ by all Americans increased by almost $198 billion … to a total of $13.877 trillion.
- ‘Private Investment’ increased by about $32 billion.
- ‘Exports’ improved by $87 billion.
- ‘Government’ spending added another $45 billion.
All told, in current dollars our US economy grew by over $361 billion during Q2. This outcome is great for America and great for the US Treasury, since tax collections increase as the size of our economy increases.
This blog, however, is called “The Steak House Index,” and is designed to help our readers forecast future US economic performance. The SHI is intended to be a predictive gauge the future performance of the US economy. Because economic slowdowns can only be identified about 6-months AFTER they begin. By the time we learn GDP has shrunk for 2 consecutive quarters, we have little opportunity to adjust our decisions – business or personal – to deal with the change. But if the SHI can help us predict when a slow-down or recession will occur, we can make better choices ahead of the curve, so to speak.
You will recall that about 70% of the US GDP results from ‘consumer spending.’ Which means, far and away, ‘Personal Consumption Expenditures’ (also known as ‘consumer spending’) is the single most important economic indicator – one that bears close scrutiny if you’re trying to gauge how the economy is doing – now and in the near future. In the macro, collectively, our behaviors are rational. Meaning, when faced with danger, we pull back. When faced with ‘financial’ danger, we do the same: we adapt our behavior to the conditions in which we find ourselves. If we – or our business (for those of you on a company ‘expense account’) – are feeling financially stressed, it’s unlikely we will take a party of 4 people to an expensive steak house for dinner on a Saturday night. Conversely, if we’re feeling flush, sure, we’ll go to Ruth’s Chris Steak House on Saturday night and shell-out $300 or $400 for dinner. Thus, the SHI postulates the availability of — or lack of availability of — reservation ‘slots’ at our pricey steakhouses is statistically meaningful.
On one hand, it seems the SHI is missing its mark. Without any doubt, ‘reading the tea leaves’ in the prior quarter SHI10 readings caused me to conclude our Q2 GDP growth figures would be strong, but no where near as robust as the actual numbers. Why? Why was I so far off? Is there something wrong with the model? Or is the data interpretation methodology flawed in some way?
Great questions. I do find it interesting that during a quarter when consumer spending increased by $198 billion, our expensive eateries were not in greater demand than the SHI10 indicated. There were plenty of Saturday-night ‘tables-for-4’ available in most markets.
On the other hand, the SHI10 did forecast an improving, or growing, economy. So the SHI10 missed the size of the improvement, but not the direction. I feel that’s meaningful. And while the Atlanta “GDPNow” Q2, 2018 model forecast was much closer than our SHI forecast, I think they had a the good fortune of capturing a couple of unusual tailwinds from government spending and the tax cuts. I don’t think these will repeat. It’s interesting to note their next forecast posted earlier today:
“The GDPNow model estimate for real GDP growth (seasonally adjusted annual rate) in the 3rd quarter of 2018 is 5.0 percent on August 1, up from 4.7 percent on July 31.”
Hmmmm…we’ll see about that!
For now, let’s take another trip to our steakhouses. Here is the long-term trend matrix:
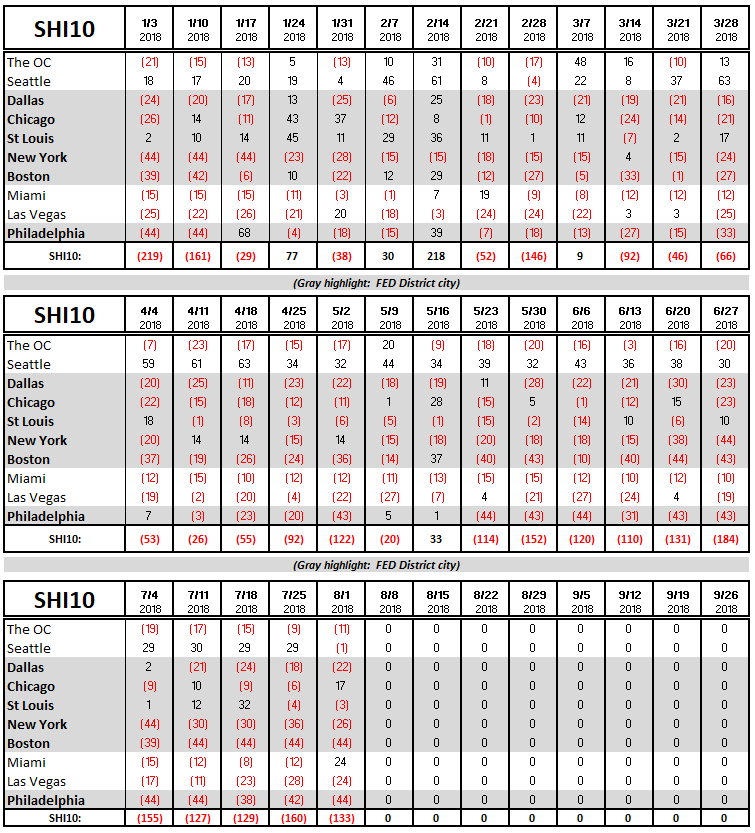
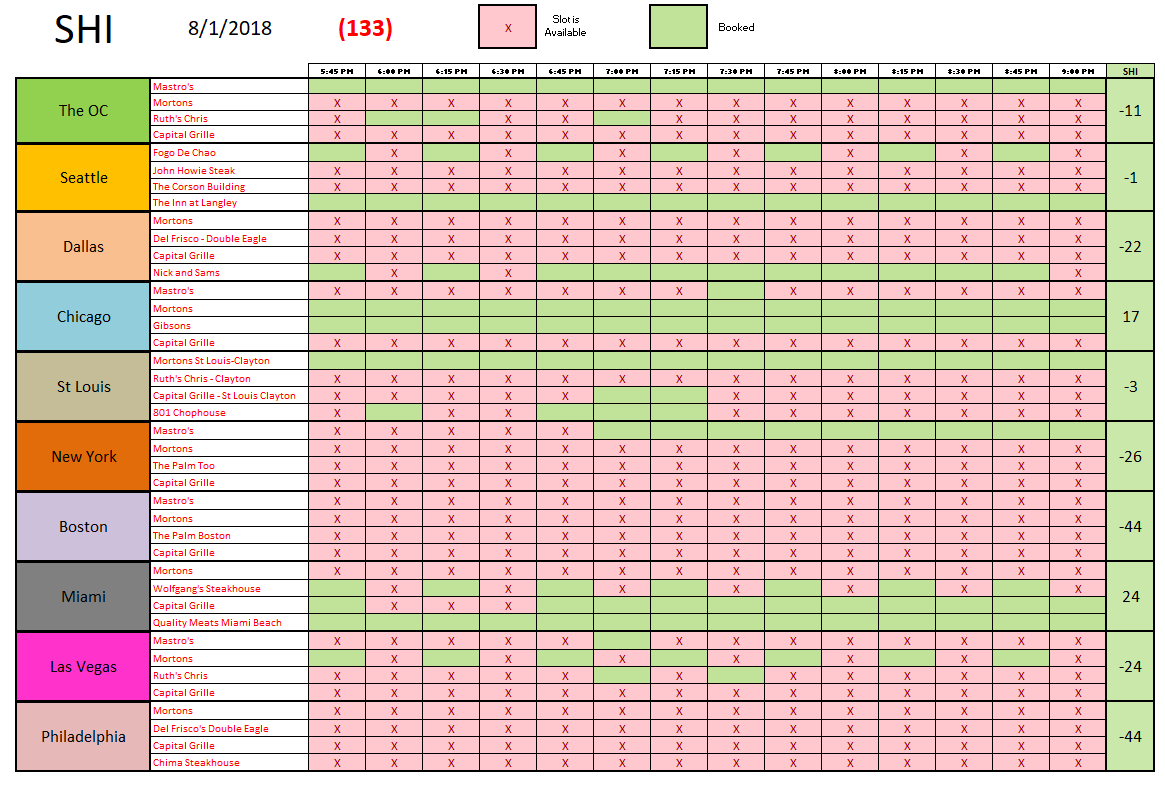
Well, this is interesting. For the first time in months, Seattle is “in the red.” And this week, while the denizens of Philly and Boston continue to explore their vegetarian “roots,” the good folks of Chicago have left the pizza parlors in favor of the steakhouses. The SHI10 reading of negative 133 is relatively consistent and range-bound. Here is this week’s SHI report:
Tasty!
It’s worth noting the FED left interest rates unchanged today. As expected.
– Terry Liebman