SHI 06.13.18 The Real GDP

SHI 6.6.18 Here We Grow Again
June 6, 2018
SHI 06.20.18 Just Ship It
June 20, 2018
‘Real’ GDP is not our real GDP. Not really.
Remember, the GDP number quoted by the Bureau of Economic Analysis (BEA), the press, economists, the FED, and pretty much everyone else is the “real” GDP figure. It is derivative of the “nominal” GDP number, a number that is higher by a measure called the “GDP Deflator.” The GDP deflator is an “economic metric” used to convert “output measured at current prices” into a “constant-dollar GDP.” In other words, real GDP is the growth number after a reduction for current inflation.
On May 30th, the BEA released their latest GDP commentary. Q1 GDP grew, per the BEA, by 2.2%. But this is the real GDP. Nominal (or ‘current dollar’) GDP — the actual GDP growth before reduction for inflation — increased by 4.2% during Q1. In dollars, the nominal increase in US gross domestic production was $202.7 billion. This followed a Q4 nominal GDP increase of $253.5 trillion.
In Q2 of 2018, it looks like US GDP will cross a staggering milestone: For the first time in history, one country (yes, I’m talking about us) will have an annual GDP exceeding $20 trillion.
- Current annual GDP is measured at $19.957 trillion.
- The NY FED ‘nowcast’ is currently forecasting a Q2 growth rate of 3.1%.
- The Atlanta FED is even more aggressive. They are predicting growth in the quarter will come in over 4.6%.
The bottom line: This quarter, US annual GDP will cross the $20 trillion barrier. Amazing. After this quarter’s tally, it is likely US GDP will exceed that of the 28 European Union nations. All other distractions aside, the US remains the proverbial ‘800 pound gorilla’ in the world of finance. This will not change any time soon.
Welcome to this week’s Steak House Index update.
If you are new to my blog, or you need a refresher on the SHI10, or its objective and methodology, I suggest you open and read the original BLOG: https://www.steakhouseindex.com/move-over-big-mac-index-here-comes-the-steak-house-index/
Why You Should Care: The US economy and US dollar are the bedrock of the world’s economy. This has been the case for decades … and will continue to be true for years to come.
Is the US economy expanding or contracting?
According to the IMF (the ‘International Monetary Fund’), the world’s annual GDP is almost $80 trillion today. US ‘current dollar’ GDP almost reached $20 trillion during Q1, 2018. We remain about 25% of global GDP. Other than China — a distant second at around $11 trillion — the GDP of no other country is close.
The objective of the SHI10 and this blog is simple: To predict US GDP movement ahead of official economic releases — an important objective since BEA (the ‘Bureau of Economic Analysis’) gross domestic product data is outdated the day it’s released.
Historically, ‘personal consumption expenditures,’ or PCE, has been the largest component of US GDP growth — typically about 2/3 of all GDP growth. In fact, the majority of all GDP increases (or declines) usually results from (increases or decreases in) consumer spending. Consumer spending is clearly a critical financial metric. In all likelihood, the most important financial metric.
The Steak House Index focuses right here … on the “consumer spending” metric. I intend the SHI10 is to be predictive, anticipating where the economy is going – not where it’s been.
Taking action: Keep up with this weekly BLOG update. Not only will we cover the SHI and SHI10, but we’ll explore related items of economic importance.
If the SHI10 index moves appreciably -– either showing massive improvement or significant declines –- indicating growing economic strength or a potential recession, we’ll discuss possible actions at that time.
The BLOG:
While the Steak House Index may not be expecting this outcome, Q2 GDP growth is likely to be a barn burner. The Atlanta FED is forecasting a 4.6% increase. If we adjusted this number to “current-dollar” GDP, using last quarter’s deflator, they expect our economy to grow by over 6.6% in Q2. 6.6% of $20 trillion, then divided by 4 (for one quarter), suggests they’re expecting nominal GDP output to increase by $330 billion. The NY FED forecast is also robust: They are forecasting Q2 economic output growth of $255 billion. Both the Atlanta and NYC forecasts are quite impressive.
Interestingly, the SHI10 is not forecasting the same level of growth. This week, the SHI10 improved only slightly from last weeks relatively tepid level:
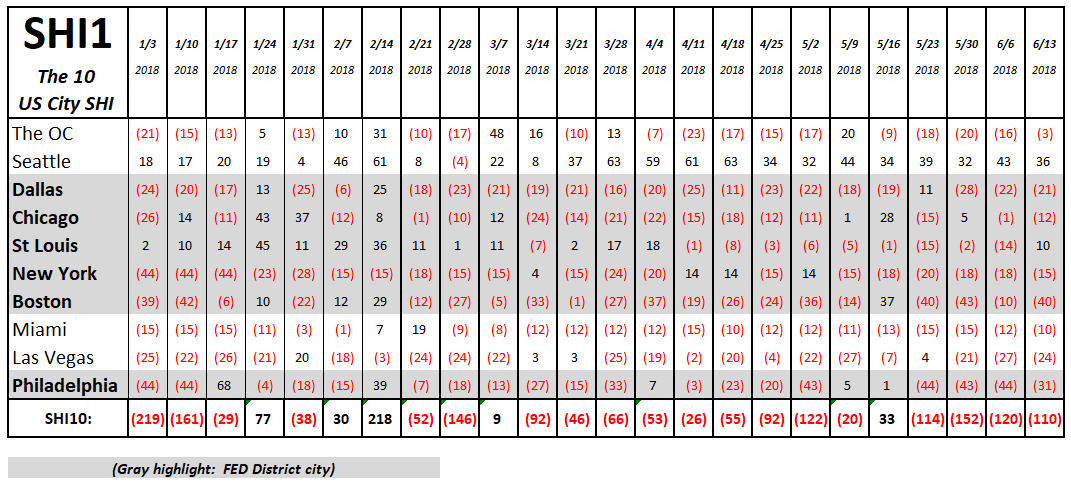
With a current reading of <-110>, the SHI10 is definitely not telling the same story as the Atlanta and NYC FEDs. Is it possible consumer spending will prove to be weaker than these forecasts suggest? Sure. And that’s what the SHI10 trend above is suggesting. The SHI10 is forecasting a lower Q2 GDP growth figure than the two FED ‘nowcasts’. Here are this week’s numbers:
How much weaker is the SHI10 GDP forecast than the Atlanta and New York ‘nowcasts’? I think probably at least 50 basis points lower. The Q2, 2018 GDP annualized growth could still exceed 3%, but not by much. For now, I’ll reserve judgement … but the “take away” is this: The SHI10 expects the consumer spending component to add only moderately to the quarter’s GDP growth figure.
The FED just finished their FOMC meeting at 11am CA time. Here are a few bullet points from their press release statement:
- Information received since the Federal Open Market Committee met in May indicates that the labor market has continued to strengthen and that economic activity has been rising at a solid rate.
- Job gains have been strong, on average, in recent months, and the unemployment rate has declined.
- Recent data suggest that growth of household spending has picked up, while business fixed investment has continued to grow strongly.
- On a 12-month basis, both overall inflation and inflation for items other than food and energy have moved close to 2 percent. Indicators of longer-term inflation expectations are little changed, on balance.
As expected, they raised the funds rate by another 25 basis points. As you know, they publish a range, not a specific rate. The last increase, on March 22, brought the range to 1.50% to 1.75%. The effective federal funds rate is continuously tracked by the St Louis FED. Here’s a 5-year graphic:
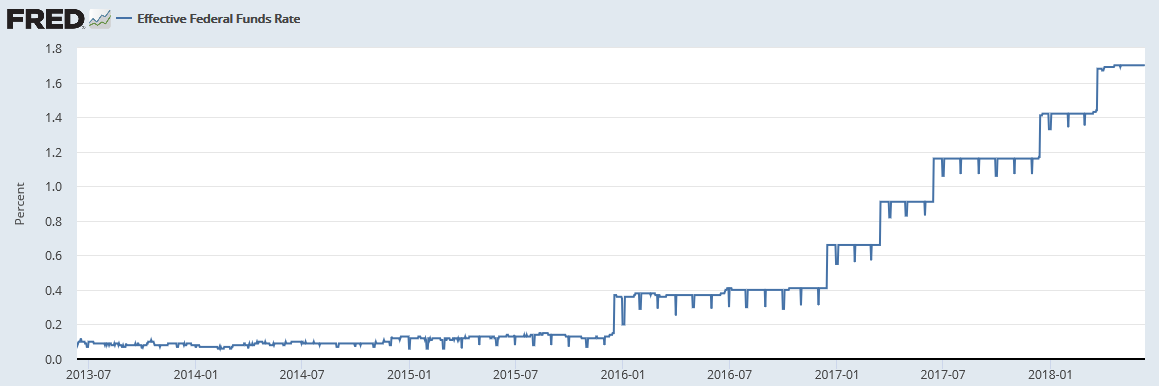
Before this increase, the effective FED funds rate was 1.70%. After the 25 basis point increase, the rate is almost 2%. You may recall that five years ago, in June of 2013, the rate was 0.10%.
The 10-year Treasury responded with … well … a yawn. Before the FED move, the 10-year T was hovering near 2.96% … after, it “spiked” up to about 2.98%. It may continue to drift up a bit … but the reaction is quite muted.
The dollar index spiked a bit. Meaning the value of the USD, when compared to a ‘basket’ of our trading partners’ currencies, increased. This was expected.
From here, short term rates like LIBOR and Prime will likely increase. According the bankrate.com, the “average” credit card rate is 17%. That will increase.
Life for the average American just became more expensive.
The bottom line: Right now, our economy is as hot as Ruths’ Chris’ Filet Mignon serving plates. But the Treasury yield curve continues to flatten. No, it is not yet inverted. But as good as Q2 GDP is likely to be, I suggest caution is the order for the day. We are one step closer to the end of our historic 9-year expansion.
- Terry Liebman